
|
CAE Inc. (CAE) Évaluation DCF |
Entièrement Modifiable: Adapté À Vos Besoins Dans Excel Ou Sheets
Conception Professionnelle: Modèles Fiables Et Conformes Aux Normes Du Secteur
Pré-Construits Pour Une Utilisation Rapide Et Efficace
Compatible MAC/PC, entièrement débloqué
Aucune Expertise N'Est Requise; Facile À Suivre
CAE Inc. (CAE) Bundle
Simplifiez l'évaluation CAE Inc. (CAE) avec cette calculatrice DCF personnalisable! Doté de la juste valeur financière de Real Cae Inc. (CAE) et de prévisions réglables, vous pouvez tester les scénarios et découvrir la juste valeur de CAE Inc. (CAE) en minutes.
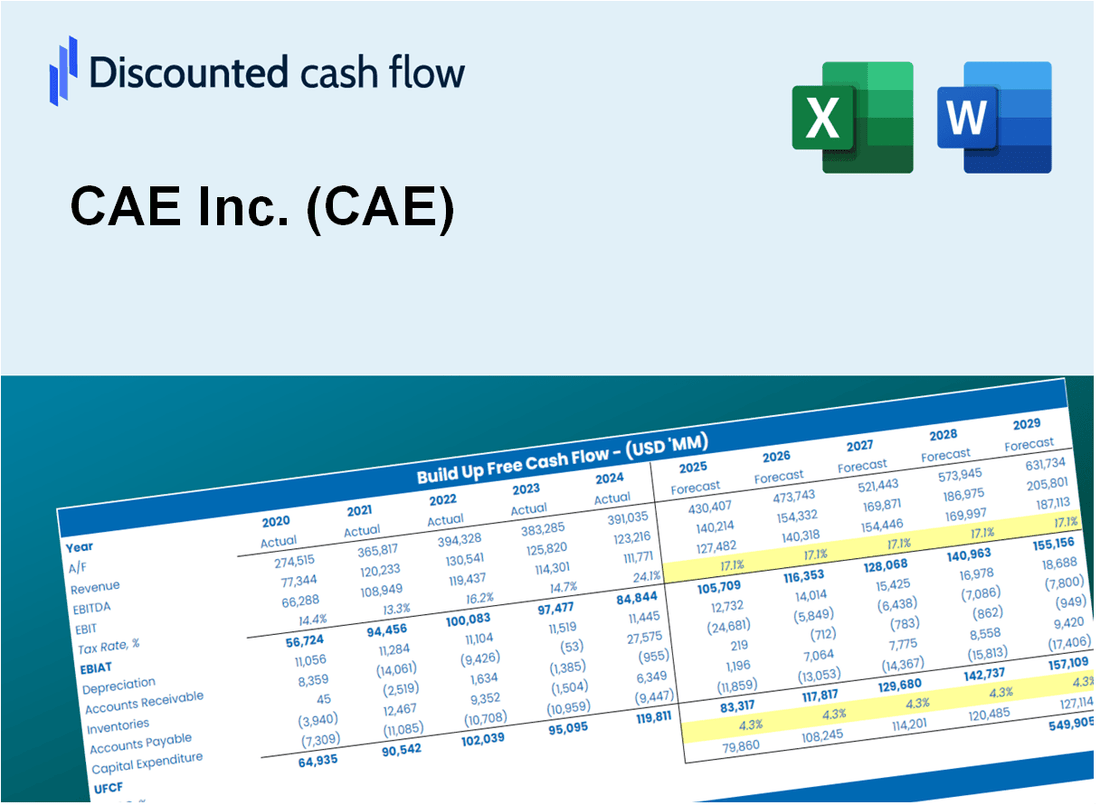
Discounted Cash Flow (DCF) - (USD MM)
| Year | AY1 2020 |
AY2 2021 |
AY3 2022 |
AY4 2023 |
AY5 2024 |
FY1 2025 |
FY2 2026 |
FY3 2027 |
FY4 2028 |
FY5 2029 |
|---|---|---|---|---|---|---|---|---|---|---|
| Revenue | 2,124.8 | 2,402.3 | 2,857.8 | 3,051.8 | 3,354.7 | 3,763.4 | 4,221.9 | 4,736.3 | 5,313.3 | 5,960.7 |
| Revenue Growth, % | 0 | 13.06 | 18.96 | 6.79 | 9.93 | 12.18 | 12.18 | 12.18 | 12.18 | 12.18 |
| EBITDA | 250.1 | 411.2 | 560.0 | 117.3 | 799.7 | 573.3 | 643.1 | 721.5 | 809.4 | 908.0 |
| EBITDA, % | 11.77 | 17.12 | 19.6 | 3.84 | 23.84 | 15.23 | 15.23 | 15.23 | 15.23 | 15.23 |
| Depreciation | 227.7 | 221.2 | 243.8 | 267.1 | 295.5 | 346.4 | 388.6 | 435.9 | 489.0 | 548.6 |
| Depreciation, % | 10.71 | 9.21 | 8.53 | 8.75 | 8.81 | 9.2 | 9.2 | 9.2 | 9.2 | 9.2 |
| EBIT | 22.4 | 190.0 | 316.2 | -149.8 | 504.2 | 226.9 | 254.6 | 285.6 | 320.4 | 359.4 |
| EBIT, % | 1.06 | 7.91 | 11.06 | -4.91 | 15.03 | 6.03 | 6.03 | 6.03 | 6.03 | 6.03 |
| Total Cash | 659.9 | 246.6 | 155.1 | 114.1 | 209.3 | 427.0 | 479.0 | 537.3 | 602.8 | 676.2 |
| Total Cash, percent | .0 | .0 | .0 | .0 | .0 | .0 | .0 | .0 | .0 | .0 |
| Account Receivables | 727.0 | 853.9 | 967.5 | 853.4 | 821.7 | 1,174.7 | 1,317.9 | 1,478.4 | 1,658.5 | 1,860.6 |
| Account Receivables, % | 34.21 | 35.55 | 33.86 | 27.96 | 24.49 | 31.21 | 31.21 | 31.21 | 31.21 | 31.21 |
| Inventories | 461.6 | 370.4 | 415.7 | 408.7 | 424.0 | 585.0 | 656.3 | 736.2 | 825.9 | 926.5 |
| Inventories, % | 21.72 | 15.42 | 14.55 | 13.39 | 12.64 | 15.54 | 15.54 | 15.54 | 15.54 | 15.54 |
| Accounts Payable | 329.1 | 310.8 | 372.0 | 400.2 | 499.5 | 522.7 | 586.4 | 657.9 | 738.0 | 828.0 |
| Accounts Payable, % | 15.49 | 12.94 | 13.02 | 13.12 | 14.89 | 13.89 | 13.89 | 13.89 | 13.89 | 13.89 |
| Capital Expenditure | -116.6 | -258.5 | -303.1 | -340.4 | -316.4 | -357.1 | -400.6 | -449.4 | -504.1 | -565.5 |
| Capital Expenditure, % | -5.49 | -10.76 | -10.6 | -11.15 | -9.43 | -9.49 | -9.49 | -9.49 | -9.49 | -9.49 |
| Tax Rate, % | 21.1 | 21.1 | 21.1 | 21.1 | 21.1 | 21.1 | 21.1 | 21.1 | 21.1 | 21.1 |
| EBITAT | 12.1 | 175.3 | 240.8 | -116.6 | 397.8 | 172.2 | 193.1 | 216.7 | 243.1 | 272.7 |
| Depreciation | ||||||||||
| Changes in Account Receivables | ||||||||||
| Changes in Inventories | ||||||||||
| Changes in Accounts Payable | ||||||||||
| Capital Expenditure | ||||||||||
| UFCF | -736.2 | 83.9 | 83.9 | -40.6 | 492.5 | -329.3 | 30.4 | 34.1 | 38.3 | 42.9 |
| WACC, % | 8.27 | 8.76 | 8.55 | 8.57 | 8.59 | 8.55 | 8.55 | 8.55 | 8.55 | 8.55 |
| PV UFCF | ||||||||||
| SUM PV UFCF | -194.8 | |||||||||
| Long Term Growth Rate, % | 2.00 | |||||||||
| Free cash flow (T + 1) | 44 | |||||||||
| Terminal Value | 669 | |||||||||
| Present Terminal Value | 444 | |||||||||
| Enterprise Value | 249 | |||||||||
| Net Debt | 2,264 | |||||||||
| Equity Value | -2,015 | |||||||||
| Diluted Shares Outstanding, MM | 320 | |||||||||
| Equity Value Per Share | -6.30 |
What You Will Get
- Genuine CAE Data: Preloaded financials – from revenue to EBIT – based on actual and projected figures for CAE Inc. (CAE).
- Comprehensive Customization: Modify all essential parameters (yellow cells) such as WACC, growth %, and tax rates.
- Immediate Valuation Updates: Automatic recalculations to assess the impact of changes on CAE Inc.'s (CAE) fair value.
- Flexible Excel Template: Designed for quick edits, scenario analysis, and in-depth projections.
- Efficient and Precise: Avoid the hassle of building models from scratch while ensuring accuracy and adaptability.
Key Features
- Advanced DCF Calculator: Features comprehensive unlevered and levered DCF valuation models tailored for CAE Inc. (CAE).
- WACC Calculator: Pre-configured Weighted Average Cost of Capital sheet with adjustable inputs specific to CAE Inc. (CAE).
- Editable Forecast Assumptions: Customize growth rates, capital expenditures, and discount rates for accurate projections.
- Built-In Financial Ratios: Evaluate profitability, leverage, and efficiency ratios relevant to CAE Inc. (CAE).
- Dashboard and Charts: Visual representations that summarize essential valuation metrics for straightforward analysis.
How It Works
- Download: Obtain the pre-configured Excel file containing CAE Inc.'s (CAE) financial data.
- Customize: Modify projections such as revenue growth, EBITDA %, and WACC to fit your analysis.
- Update Automatically: The intrinsic value and NPV calculations refresh in real-time as you make changes.
- Test Scenarios: Generate various forecasts and instantly compare their results.
- Make Decisions: Leverage the valuation insights to inform your investment choices.
Why Choose This Calculator for CAE Inc. (CAE)?
- Accurate Data: Utilize real CAE financials to ensure dependable valuation outcomes.
- Customizable: Modify essential parameters like growth rates, WACC, and tax rates to align with your forecasts.
- Time-Saving: Pre-configured calculations save you from building models from the ground up.
- Professional-Grade Tool: Tailored for investors, analysts, and consultants in the aerospace and defense sector.
- User-Friendly: Designed with an intuitive interface and clear instructions for all users.
Who Should Use This Product?
- Investors: Evaluate CAE Inc.’s (CAE) financial health before making investment decisions.
- CFOs and Financial Analysts: Optimize valuation methods and assess future forecasts for CAE Inc. (CAE).
- Startup Founders: Understand the valuation strategies of established companies like CAE Inc. (CAE).
- Consultants: Provide detailed valuation analyses and reports for clients focused on CAE Inc. (CAE).
- Students and Educators: Utilize real-time data from CAE Inc. (CAE) to enhance learning and teaching of valuation principles.
What the Template Contains
- Operating and Balance Sheet Data: Pre-filled CAE Inc. (CAE) historical data and forecasts, including revenue, EBITDA, EBIT, and capital expenditures.
- WACC Calculation: A dedicated sheet for Weighted Average Cost of Capital (WACC), featuring parameters like Beta, risk-free rate, and share price.
- DCF Valuation (Unlevered and Levered): Editable Discounted Cash Flow models illustrating intrinsic value with comprehensive calculations.
- Financial Statements: Pre-loaded financial statements (annual and quarterly) to facilitate analysis.
- Key Ratios: Includes profitability, leverage, and efficiency ratios for CAE Inc. (CAE).
- Dashboard and Charts: Visual summary of valuation outputs and assumptions for easy result analysis.
Disclaimer
All information, articles, and product details provided on this website are for general informational and educational purposes only. We do not claim any ownership over, nor do we intend to infringe upon, any trademarks, copyrights, logos, brand names, or other intellectual property mentioned or depicted on this site. Such intellectual property remains the property of its respective owners, and any references here are made solely for identification or informational purposes, without implying any affiliation, endorsement, or partnership.
We make no representations or warranties, express or implied, regarding the accuracy, completeness, or suitability of any content or products presented. Nothing on this website should be construed as legal, tax, investment, financial, medical, or other professional advice. In addition, no part of this site—including articles or product references—constitutes a solicitation, recommendation, endorsement, advertisement, or offer to buy or sell any securities, franchises, or other financial instruments, particularly in jurisdictions where such activity would be unlawful.
All content is of a general nature and may not address the specific circumstances of any individual or entity. It is not a substitute for professional advice or services. Any actions you take based on the information provided here are strictly at your own risk. You accept full responsibility for any decisions or outcomes arising from your use of this website and agree to release us from any liability in connection with your use of, or reliance upon, the content or products found herein.