
|
Peut finir les maisons limitées (canfinhome.NS) l'évaluation DCF |
Entièrement Modifiable: Adapté À Vos Besoins Dans Excel Ou Sheets
Conception Professionnelle: Modèles Fiables Et Conformes Aux Normes Du Secteur
Pré-Construits Pour Une Utilisation Rapide Et Efficace
Compatible MAC/PC, entièrement débloqué
Aucune Expertise N'Est Requise; Facile À Suivre
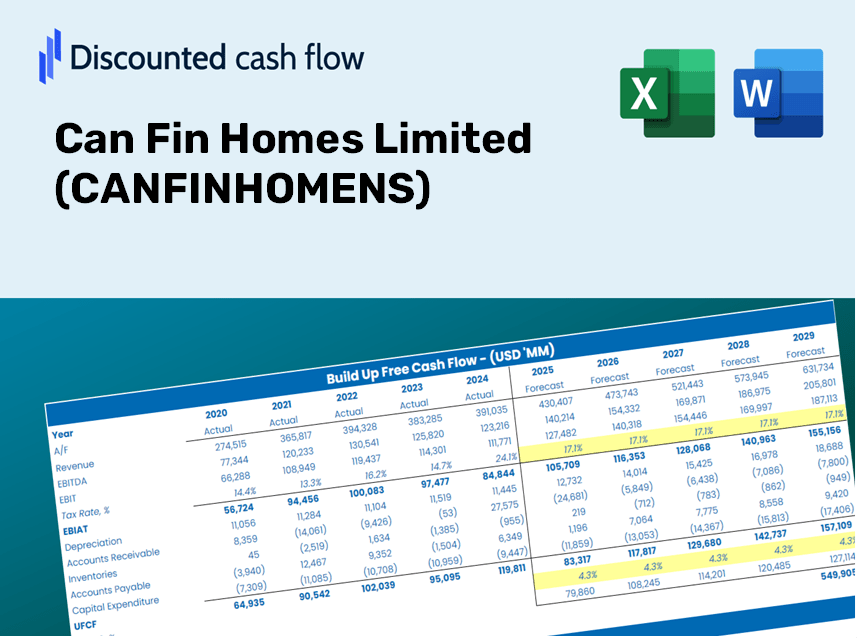
Can Fin Homes Limited (CANFINHOME.NS) Bundle
Simplify Can Fin Homes Limited Valuation avec cette calculatrice DCF personnalisable! Doté de Real Can Fin Homes Limited Financial Limited et des intrants de prévision ajustés, vous pouvez tester les scénarios et découvrir la juste valeur de Can Fin Homes Limited en minutes.
Discounted Cash Flow (DCF) - (USD MM)
| Year | AY1 2021 |
AY2 2022 |
AY3 2023 |
AY4 2024 |
AY5 2025 |
FY1 2026 |
FY2 2027 |
FY3 2028 |
FY4 2029 |
FY5 2030 |
|---|---|---|---|---|---|---|---|---|---|---|
| Revenue | 20,181.4 | 19,878.3 | 27,420.0 | 35,240.7 | 38,791.5 | 46,068.4 | 54,710.2 | 64,973.2 | 77,161.4 | 91,636.0 |
| Revenue Growth, % | 0 | -1.5 | 37.94 | 28.52 | 10.08 | 18.76 | 18.76 | 18.76 | 18.76 | 18.76 |
| EBITDA | -.6 | .0 | 25,144.6 | 9,702.5 | 11,661.1 | 13,755.2 | 16,335.5 | 19,399.9 | 23,039.1 | 27,361.0 |
| EBITDA, % | -0.0029433 | -0.000221346662 | 91.7 | 27.53 | 30.06 | 29.86 | 29.86 | 29.86 | 29.86 | 29.86 |
| Depreciation | -6,176.4 | -6,350.6 | 124.6 | 127.1 | 128.7 | -5,657.7 | -6,719.0 | -7,979.4 | -9,476.2 | -11,253.8 |
| Depreciation, % | -30.6 | -31.95 | 0.45425 | 0.3608 | 0.33172 | -12.28 | -12.28 | -12.28 | -12.28 | -12.28 |
| EBIT | 6,175.8 | 6,350.6 | 25,020.0 | 9,575.3 | 11,532.5 | 19,412.9 | 23,054.5 | 27,379.3 | 32,515.3 | 38,614.8 |
| EBIT, % | 30.6 | 31.95 | 91.25 | 27.17 | 29.73 | 42.14 | 42.14 | 42.14 | 42.14 | 42.14 |
| Total Cash | 224.5 | 3,248.9 | 3,095.0 | 4,589.7 | 3,076.4 | 4,579.0 | 5,438.0 | 6,458.1 | 7,669.5 | 9,108.3 |
| Total Cash, percent | .0 | .0 | .0 | .0 | .0 | .0 | .0 | .0 | .0 | .0 |
| Account Receivables | 16.5 | 29,926.5 | 88.6 | 8.9 | 9.3 | 9,255.5 | 10,991.7 | 13,053.7 | 15,502.4 | 18,410.4 |
| Account Receivables, % | 0.08169404 | 150.55 | 0.32328 | 0.02521802 | 0.02399493 | 20.09 | 20.09 | 20.09 | 20.09 | 20.09 |
| Inventories | .0 | 3,217.9 | 3,161.9 | .0 | .0 | 2,554.0 | 3,033.1 | 3,602.0 | 4,277.7 | 5,080.2 |
| Inventories, % | 0 | 16.19 | 11.53 | 0 | 0 | 5.54 | 5.54 | 5.54 | 5.54 | 5.54 |
| Accounts Payable | 43.3 | 55.5 | 80.5 | 48.3 | 60.8 | 99.6 | 118.3 | 140.4 | 166.8 | 198.1 |
| Accounts Payable, % | 0.21435 | 0.27927 | 0.29355 | 0.13702 | 0.15663 | 0.21617 | 0.21617 | 0.21617 | 0.21617 | 0.21617 |
| Capital Expenditure | -23.4 | -34.8 | -92.0 | -199.4 | -166.5 | -149.4 | -177.4 | -210.7 | -250.3 | -297.2 |
| Capital Expenditure, % | -0.11607 | -0.1752 | -0.33538 | -0.56589 | -0.42909 | -0.32433 | -0.32433 | -0.32433 | -0.32433 | -0.32433 |
| Tax Rate, % | 20.45 | 20.45 | 20.45 | 20.45 | 20.45 | 20.45 | 20.45 | 20.45 | 20.45 | 20.45 |
| EBITAT | 4,560.6 | 4,711.1 | 18,861.8 | 7,507.0 | 9,174.5 | 14,807.0 | 17,584.6 | 20,883.2 | 24,800.7 | 29,453.0 |
| Depreciation | ||||||||||
| Changes in Account Receivables | ||||||||||
| Changes in Inventories | ||||||||||
| Changes in Accounts Payable | ||||||||||
| Capital Expenditure | ||||||||||
| UFCF | -1,612.4 | -34,790.0 | 48,813.2 | 10,644.2 | 9,148.8 | -2,761.5 | 8,491.5 | 10,084.4 | 11,976.1 | 14,222.7 |
| WACC, % | 5.34 | 5.35 | 5.42 | 5.58 | 5.65 | 5.47 | 5.47 | 5.47 | 5.47 | 5.47 |
| PV UFCF | ||||||||||
| SUM PV UFCF | 34,189.7 | |||||||||
| Long Term Growth Rate, % | 2.00 | |||||||||
| Free cash flow (T + 1) | 14,507 | |||||||||
| Terminal Value | 418,350 | |||||||||
| Present Terminal Value | 320,584 | |||||||||
| Enterprise Value | 354,774 | |||||||||
| Net Debt | 345,562 | |||||||||
| Equity Value | 9,211 | |||||||||
| Diluted Shares Outstanding, MM | 133 | |||||||||
| Equity Value Per Share | 69.18 |
What You Will Receive
- Customizable Forecast Inputs: Effortlessly modify assumptions (growth %, margins, WACC) to explore various scenarios.
- Comprehensive Data: Can Fin Homes Limited’s (CANFINHOMENS) financial data pre-filled to streamline your analysis.
- Automated DCF Outputs: The template provides calculations for Net Present Value (NPV) and intrinsic value automatically.
- Professional and Adaptable: A refined Excel model tailored to meet your valuation requirements.
- Designed for Analysts and Investors: Perfect for examining projections, validating strategies, and improving efficiency.
Key Features
- Comprehensive CANFINHOMENS Data: Pre-populated with Can Fin Homes Limited's historical financial data and future projections.
- Fully Adjustable Parameters: Tailor revenue growth, profit margins, WACC, tax rates, and capital expenditures to your preferences.
- Dynamic Valuation Framework: Real-time updates to Net Present Value (NPV) and intrinsic value reflecting your customized inputs.
- Scenario Analysis: Develop various forecasting scenarios to evaluate different valuation results.
- Intuitive User Interface: Clean and organized design catering to both professionals and newcomers.
How Can Fin Homes Limited Works
- 1. Access the Template: Download and open the Excel file containing Can Fin Homes Limited’s (CANFINHOMENS) preloaded data.
- 2. Modify Assumptions: Adjust critical inputs such as growth rates, WACC, and capital expenditures.
- 3. View Immediate Results: The DCF model automatically calculates the intrinsic value and NPV.
- 4. Explore Scenarios: Compare various forecasts to evaluate different valuation possibilities.
- 5. Present with Assurance: Deliver professional valuation insights to bolster your decision-making.
Why Choose This Calculator for Can Fin Homes Limited (CANFINHOMENS)?
- Precise Financials: Utilize accurate data from Can Fin Homes for trustworthy valuation outcomes.
- Tailored Options: Modify essential factors such as growth rates, WACC, and tax rates to align with your forecasts.
- Efficient: Pre-configured calculations save you the hassle of starting from scratch.
- Expert Tool: Crafted for investors, analysts, and consultants focused on Can Fin Homes.
- Easy to Use: An intuitive design and clear, step-by-step guidance ensure accessibility for all users.
Who Can Benefit from This Product?
- Professional Investors: Develop comprehensive and trustworthy valuation models for portfolio evaluation.
- Corporate Finance Teams: Assess valuation scenarios to inform internal strategies.
- Consultants and Advisors: Offer clients precise valuation insights for Can Fin Homes Limited (CANFINHOMENS) stock.
- Students and Educators: Utilize real-world data to practice and teach financial modeling techniques.
- Industry Enthusiasts: Gain insights into how companies like Can Fin Homes Limited (CANFINHOMENS) are valued in the marketplace.
Overview of the Template Features
- Preloaded CANFINHOMENS Data: Historical and forecasted financial data, encompassing revenue, EBIT, and capital expenditures.
- DCF and WACC Models: High-quality spreadsheets for assessing intrinsic value and Weighted Average Cost of Capital.
- Customizable Inputs: Yellow-highlighted fields for modifying revenue growth, tax rates, and discount rates.
- Financial Statements: Detailed annual and quarterly financial reports for in-depth analysis.
- Key Ratios: Metrics for profitability, leverage, and efficiency to assess performance.
- Dashboard and Charts: Visual representations of valuation results and underlying assumptions.
Disclaimer
All information, articles, and product details provided on this website are for general informational and educational purposes only. We do not claim any ownership over, nor do we intend to infringe upon, any trademarks, copyrights, logos, brand names, or other intellectual property mentioned or depicted on this site. Such intellectual property remains the property of its respective owners, and any references here are made solely for identification or informational purposes, without implying any affiliation, endorsement, or partnership.
We make no representations or warranties, express or implied, regarding the accuracy, completeness, or suitability of any content or products presented. Nothing on this website should be construed as legal, tax, investment, financial, medical, or other professional advice. In addition, no part of this site—including articles or product references—constitutes a solicitation, recommendation, endorsement, advertisement, or offer to buy or sell any securities, franchises, or other financial instruments, particularly in jurisdictions where such activity would be unlawful.
All content is of a general nature and may not address the specific circumstances of any individual or entity. It is not a substitute for professional advice or services. Any actions you take based on the information provided here are strictly at your own risk. You accept full responsibility for any decisions or outcomes arising from your use of this website and agree to release us from any liability in connection with your use of, or reliance upon, the content or products found herein.