
|
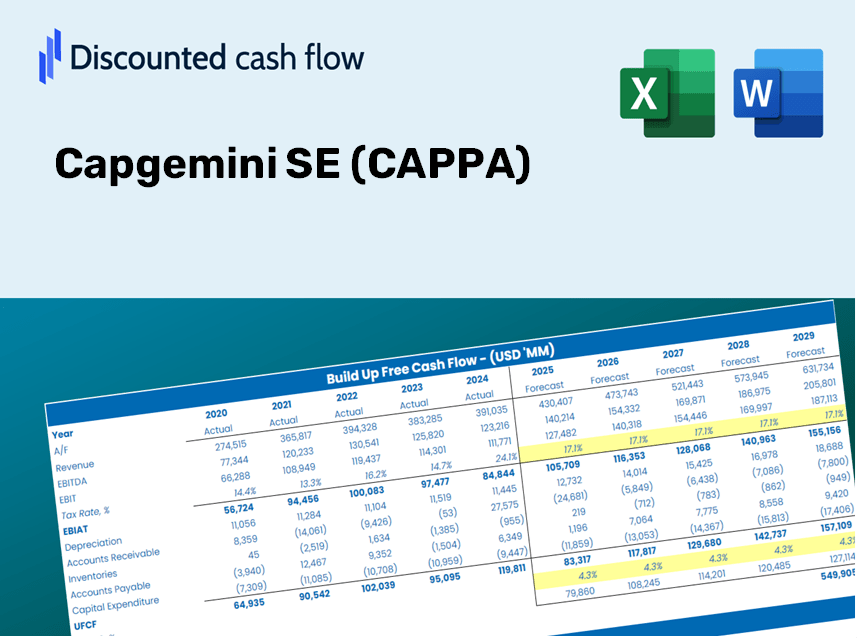
Capgemini SE (Cap.Pa) Évaluation DCF |
Entièrement Modifiable: Adapté À Vos Besoins Dans Excel Ou Sheets
Conception Professionnelle: Modèles Fiables Et Conformes Aux Normes Du Secteur
Pré-Construits Pour Une Utilisation Rapide Et Efficace
Compatible MAC/PC, entièrement débloqué
Aucune Expertise N'Est Requise; Facile À Suivre
Capgemini SE (CAP.PA) Bundle
Conçu pour la précision, notre calculatrice DCF Capgemini SE (CAPPA) vous permet d'évaluer l'évaluation de Capgemini à l'aide de données financières réelles, offrant une flexibilité complète pour modifier tous les paramètres clés pour des projections améliorées.
Discounted Cash Flow (DCF) - (USD MM)
| Year | AY1 2020 |
AY2 2021 |
AY3 2022 |
AY4 2023 |
AY5 2024 |
FY1 2025 |
FY2 2026 |
FY3 2027 |
FY4 2028 |
FY5 2029 |
|---|---|---|---|---|---|---|---|---|---|---|
| Revenue | 15,848.0 | 18,160.0 | 21,995.0 | 22,522.0 | 22,096.0 | 24,096.3 | 26,277.7 | 28,656.5 | 31,250.7 | 34,079.8 |
| Revenue Growth, % | 0 | 14.59 | 21.12 | 2.4 | -1.89 | 9.05 | 9.05 | 9.05 | 9.05 | 9.05 |
| EBITDA | 2,159.0 | 2,512.0 | 3,131.0 | 3,187.0 | 3,232.0 | 3,396.1 | 3,703.5 | 4,038.8 | 4,404.4 | 4,803.1 |
| EBITDA, % | 13.62 | 13.83 | 14.24 | 14.15 | 14.63 | 14.09 | 14.09 | 14.09 | 14.09 | 14.09 |
| Depreciation | 649.0 | 672.0 | 719.0 | 700.0 | 683.0 | 832.0 | 907.3 | 989.4 | 1,079.0 | 1,176.7 |
| Depreciation, % | 4.1 | 3.7 | 3.27 | 3.11 | 3.09 | 3.45 | 3.45 | 3.45 | 3.45 | 3.45 |
| EBIT | 1,510.0 | 1,840.0 | 2,412.0 | 2,487.0 | 2,549.0 | 2,564.1 | 2,796.2 | 3,049.3 | 3,325.4 | 3,626.4 |
| EBIT, % | 9.53 | 10.13 | 10.97 | 11.04 | 11.54 | 10.64 | 10.64 | 10.64 | 10.64 | 10.64 |
| Total Cash | 3,174.0 | 3,514.0 | 4,188.0 | 3,697.0 | 3,057.0 | 4,273.2 | 4,660.0 | 5,081.9 | 5,541.9 | 6,043.6 |
| Total Cash, percent | .0 | .0 | .0 | .0 | .0 | .0 | .0 | .0 | .0 | .0 |
| Account Receivables | 4,162.0 | 4,942.0 | 5,552.0 | 5,470.0 | 5,076.0 | 6,071.2 | 6,620.8 | 7,220.2 | 7,873.8 | 8,586.6 |
| Account Receivables, % | 26.26 | 27.21 | 25.24 | 24.29 | 22.97 | 25.2 | 25.2 | 25.2 | 25.2 | 25.2 |
| Inventories | .0 | .0 | .0 | 132.0 | .0 | 28.2 | 30.8 | 33.6 | 36.6 | 39.9 |
| Inventories, % | 0 | 0 | 0 | 0.58609 | 0 | 0.11722 | 0.11722 | 0.11722 | 0.11722 | 0.11722 |
| Accounts Payable | 1,209.0 | 1,628.0 | 1,712.0 | 1,537.0 | 1,642.0 | 1,861.8 | 2,030.4 | 2,214.2 | 2,414.6 | 2,633.2 |
| Accounts Payable, % | 7.63 | 8.96 | 7.78 | 6.82 | 7.43 | 7.73 | 7.73 | 7.73 | 7.73 | 7.73 |
| Capital Expenditure | -206.0 | -266.0 | -290.0 | -259.0 | -315.0 | -320.9 | -349.9 | -381.6 | -416.2 | -453.9 |
| Capital Expenditure, % | -1.3 | -1.46 | -1.32 | -1.15 | -1.43 | -1.33 | -1.33 | -1.33 | -1.33 | -1.33 |
| Tax Rate, % | 29.13 | 29.13 | 29.13 | 29.13 | 29.13 | 29.13 | 29.13 | 29.13 | 29.13 | 29.13 |
| EBITAT | 1,066.5 | 1,267.2 | 1,648.1 | 1,795.1 | 1,806.4 | 1,799.3 | 1,962.2 | 2,139.8 | 2,333.6 | 2,544.8 |
| Depreciation | ||||||||||
| Changes in Account Receivables | ||||||||||
| Changes in Inventories | ||||||||||
| Changes in Accounts Payable | ||||||||||
| Capital Expenditure | ||||||||||
| UFCF | -1,443.5 | 1,312.2 | 1,551.1 | 2,011.1 | 2,805.4 | 1,506.8 | 2,135.9 | 2,329.3 | 2,540.2 | 2,770.1 |
| WACC, % | 6.66 | 6.65 | 6.64 | 6.67 | 6.66 | 6.66 | 6.66 | 6.66 | 6.66 | 6.66 |
| PV UFCF | ||||||||||
| SUM PV UFCF | 9,179.6 | |||||||||
| Long Term Growth Rate, % | 3.00 | |||||||||
| Free cash flow (T + 1) | 2,853 | |||||||||
| Terminal Value | 77,982 | |||||||||
| Present Terminal Value | 56,495 | |||||||||
| Enterprise Value | 65,675 | |||||||||
| Net Debt | 3,288 | |||||||||
| Equity Value | 62,387 | |||||||||
| Diluted Shares Outstanding, MM | 176 | |||||||||
| Equity Value Per Share | 353.72 |
What You Will Receive
- Authentic Capgemini Data: Comprehensive financials – including revenue and EBIT – derived from real and projected statistics.
- Complete Customization: Modify all key parameters (yellow cells) such as WACC, growth %, and tax rates to suit your needs.
- Immediate Valuation Adjustments: Automatic recalculations to assess the effects of changes on Capgemini’s fair value.
- Flexible Excel Template: Designed for easy modifications, scenario analysis, and in-depth projections.
- Efficient and Precise: Avoid the hassle of building models from scratch while ensuring accuracy and adaptability.
Notable Features of Capgemini SE (CAPPA)
- Customizable Forecast Inputs: Adjust essential parameters such as revenue growth, EBITDA %, and capital expenditures with ease.
- Instant DCF Valuation: Provides real-time calculations of intrinsic value, NPV, and additional financial metrics.
- High-Precision Accuracy: Leverages Capgemini’s financial data for precise and realistic valuation results.
- Simplified Scenario Analysis: Effortlessly test various assumptions and analyze different outcomes.
- Efficiency Booster: Saves time by removing the necessity of constructing intricate valuation models from the ground up.
How It Operates
- 1. Access the Template: Download and open the Excel file containing Capgemini SE’s (CAPPA) preloaded data.
- 2. Modify Assumptions: Adjust key inputs such as growth rates, WACC, and capital expenditures.
- 3. View Results Instantly: The DCF model automatically calculates intrinsic value and NPV in real-time.
- 4. Explore Scenarios: Evaluate various forecasts to analyze different valuation outcomes.
- 5. Present with Confidence: Deliver professional valuation insights to support your decision-making process.
Why Choose This Calculator for Capgemini SE (CAPPA)?
- All-in-One Solution: Combines DCF, WACC, and financial ratio analyses for a comprehensive assessment.
- Flexible Inputs: Modify the highlighted cells to evaluate various financial scenarios.
- In-Depth Analysis: Automatically determines the intrinsic value and Net Present Value for Capgemini SE (CAPPA).
- Preloaded Insights: Access historical and projected data to ensure a solid foundation for your analysis.
- Expert-Level Quality: Tailored for financial analysts, investors, and consulting professionals.
Who Can Benefit from This Product?
- Finance Students: Master valuation methodologies and apply them using real-world data.
- Academics: Integrate advanced financial models into your teaching or research initiatives.
- Investors: Evaluate your hypotheses and assess valuation results for Capgemini SE (CAPPA) stock.
- Analysts: Enhance efficiency with a ready-made, customizable DCF model tailored to your needs.
- Small Business Owners: Explore how large public firms like Capgemini SE (CAPPA) are evaluated by financial experts.
Contents of the Template
- Pre-Filled DCF Model: Capgemini SE's financial data preloaded for immediate application.
- WACC Calculator: Comprehensive calculations for the Weighted Average Cost of Capital.
- Financial Ratios: Analyze Capgemini SE's profitability, leverage, and operational efficiency.
- Editable Inputs: Modify assumptions such as growth rates, profit margins, and CAPEX to suit your scenarios.
- Financial Statements: Access annual and quarterly reports for thorough analysis.
- Interactive Dashboard: Effortlessly visualize essential valuation metrics and outcomes.
Disclaimer
All information, articles, and product details provided on this website are for general informational and educational purposes only. We do not claim any ownership over, nor do we intend to infringe upon, any trademarks, copyrights, logos, brand names, or other intellectual property mentioned or depicted on this site. Such intellectual property remains the property of its respective owners, and any references here are made solely for identification or informational purposes, without implying any affiliation, endorsement, or partnership.
We make no representations or warranties, express or implied, regarding the accuracy, completeness, or suitability of any content or products presented. Nothing on this website should be construed as legal, tax, investment, financial, medical, or other professional advice. In addition, no part of this site—including articles or product references—constitutes a solicitation, recommendation, endorsement, advertisement, or offer to buy or sell any securities, franchises, or other financial instruments, particularly in jurisdictions where such activity would be unlawful.
All content is of a general nature and may not address the specific circumstances of any individual or entity. It is not a substitute for professional advice or services. Any actions you take based on the information provided here are strictly at your own risk. You accept full responsibility for any decisions or outcomes arising from your use of this website and agree to release us from any liability in connection with your use of, or reliance upon, the content or products found herein.