
|
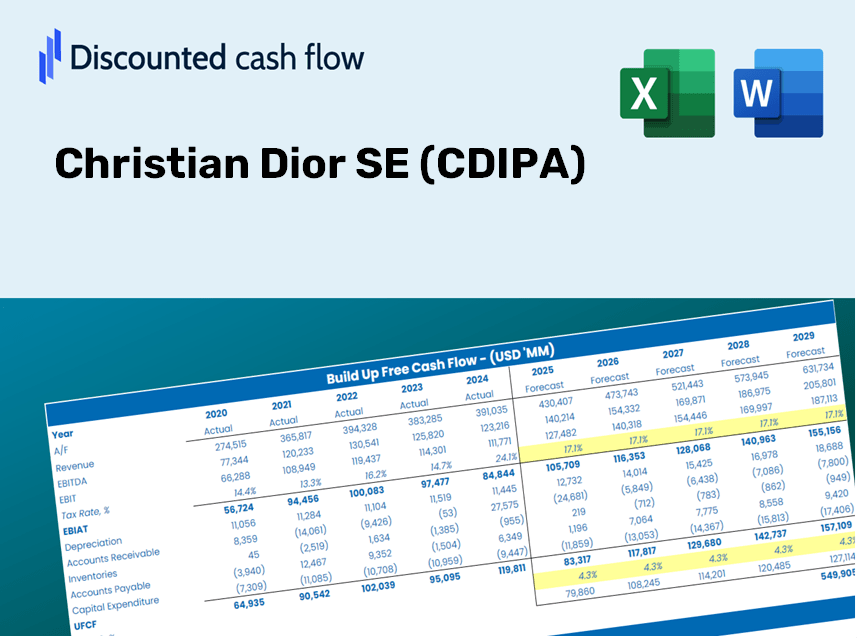
Christian Dior SE (CDI.PA) DCF Valuation |
Entièrement Modifiable: Adapté À Vos Besoins Dans Excel Ou Sheets
Conception Professionnelle: Modèles Fiables Et Conformes Aux Normes Du Secteur
Pré-Construits Pour Une Utilisation Rapide Et Efficace
Compatible MAC/PC, entièrement débloqué
Aucune Expertise N'Est Requise; Facile À Suivre
Christian Dior SE (CDI.PA) Bundle
Optimize your time and improve precision with our (CDIPA) DCF Calculator! Utilizing real data from Christian Dior and customizable assumptions, this tool empowers you to forecast, analyze, and value Christian Dior SE like a seasoned investor.
Discounted Cash Flow (DCF) - (USD MM)
| Year | AY1 2021 |
AY2 2022 |
AY3 2023 |
AY4 2024 |
AY5 2025 |
FY1 2026 |
FY2 2027 |
FY3 2028 |
FY4 2029 |
FY5 2030 |
|---|---|---|---|---|---|---|---|---|---|---|
| Revenue | 64,215.0 | 79,184.0 | 86,153.0 | 84,683.0 | 80,807.0 | 83,446.3 | 86,171.9 | 88,986.5 | 91,893.0 | 94,894.4 |
| Revenue Growth, % | 0 | 23.31 | 8.8 | -1.71 | -4.58 | 3.27 | 3.27 | 3.27 | 3.27 | 3.27 |
| EBITDA | 23,266.0 | 23,220.0 | 25,144.0 | 23,440.0 | 25,521.0 | 25,702.0 | 26,541.5 | 27,408.4 | 28,303.6 | 29,228.1 |
| EBITDA, % | 36.23 | 29.32 | 29.19 | 27.68 | 31.58 | 30.8 | 30.8 | 30.8 | 30.8 | 30.8 |
| Depreciation | 5,827.0 | 2,234.0 | 2,474.0 | 4,567.0 | 7,999.0 | 8,598.2 | 9,226.4 | 9,884.8 | 10,574.8 | 11,297.6 |
| Depreciation, % | 9.07 | 2.82 | 2.87 | 5.39 | 9.9 | 10.3 | 10.71 | 11.11 | 11.51 | 11.91 |
| EBIT | 17,439.0 | 20,986.0 | 22,670.0 | 18,873.0 | 17,522.0 | 20,685.4 | 21,361.0 | 22,058.7 | 22,779.2 | 23,523.2 |
| EBIT, % | 27.16 | 26.5 | 26.31 | 22.29 | 21.68 | 24.79 | 24.79 | 24.79 | 24.79 | 24.79 |
| Total Cash | 10,666.0 | 11,234.0 | 11,477.0 | 13,773.0 | 8,941.0 | 11,924.1 | 12,313.5 | 12,715.7 | 13,131.0 | 13,559.9 |
| Total Cash, percent | .0 | .0 | .0 | .0 | .0 | .0 | .0 | .0 | .0 | .0 |
| Account Receivables | 4,564.0 | 5,133.0 | 5,578.0 | 5,762.0 | 5,091.0 | 5,535.6 | 5,716.4 | 5,903.1 | 6,095.9 | 6,295.0 |
| Account Receivables, % | 7.11 | 6.48 | 6.47 | 6.8 | 6.3 | 6.63 | 6.63 | 6.63 | 6.63 | 6.63 |
| Inventories | 16,549.0 | 20,319.0 | 22,952.0 | 23,669.0 | 22,659.0 | 23,957.3 | 25,310.8 | 26,721.8 | 28,192.3 | 29,724.6 |
| Inventories, % | 25.77 | 25.66 | 26.64 | 27.95 | 28.04 | 28.71 | 29.37 | 30.03 | 30.68 | 31.32 |
| Accounts Payable | 7,086.0 | 8,788.0 | 9,049.0 | 8,630.0 | 8,222.0 | 8,845.7 | 9,134.6 | 9,433.0 | 9,741.1 | 10,059.2 |
| Accounts Payable, % | 11.03 | 11.1 | 10.5 | 10.19 | 10.17 | 10.6 | 10.6 | 10.6 | 10.6 | 10.6 |
| Capital Expenditure | -3,255.0 | -4,969.0 | -7,807.0 | -5,531.0 | -4,567.0 | -5,438.9 | -5,616.5 | -5,800.0 | -5,989.4 | -6,185.0 |
| Capital Expenditure, % | -5.07 | -6.28 | -9.06 | -6.53 | -5.65 | -6.52 | -6.52 | -6.52 | -6.52 | -6.52 |
| Tax Rate, % | 72.87 | 72.87 | 72.87 | 72.87 | 72.87 | 72.87 | 72.87 | 72.87 | 72.87 | 72.87 |
| EBITAT | 5,016.2 | 6,054.0 | 6,607.7 | 5,430.1 | 4,754.3 | 5,902.1 | 6,094.9 | 6,294.0 | 6,499.6 | 6,711.9 |
| Depreciation | ||||||||||
| Changes in Account Receivables | ||||||||||
| Changes in Inventories | ||||||||||
| Changes in Accounts Payable | ||||||||||
| Capital Expenditure | ||||||||||
| UFCF | -6,438.8 | 682.0 | -1,542.3 | 3,146.1 | 9,459.3 | 7,942.2 | 8,459.3 | 9,079.6 | 9,729.8 | 10,411.2 |
| WACC, % | 5.42 | 5.42 | 5.43 | 5.42 | 5.4 | 5.42 | 5.42 | 5.42 | 5.42 | 5.42 |
| PV UFCF | ||||||||||
| SUM PV UFCF | 38,770.6 | |||||||||
| Long Term Growth Rate, % | 2.00 | |||||||||
| Free cash flow (T + 1) | 10,619 | |||||||||
| Terminal Value | 310,577 | |||||||||
| Present Terminal Value | 238,544 | |||||||||
| Enterprise Value | 277,315 | |||||||||
| Net Debt | 40,819 | |||||||||
| Equity Value | 236,496 | |||||||||
| Diluted Shares Outstanding, MM | 180 | |||||||||
| Equity Value Per Share | 1,310.87 |
What You Will Receive
- Comprehensive Financial Model: Utilize Christian Dior SE's actual data for accurate DCF valuation.
- Complete Forecasting Control: Modify revenue growth, profit margins, WACC, and other essential parameters.
- Real-Time Calculations: Automatic updates allow you to view results instantly as you make adjustments.
- Professional-Grade Template: A polished Excel file crafted for high-quality valuation.
- Flexible and Reusable: Designed for adaptability, supporting repeated use for in-depth forecasts.
Key Features
- Authentic Christian Dior Financials: Obtain precise pre-loaded historical data and future forecasts.
- Adjustable Forecast Assumptions: Modify the yellow-highlighted cells such as WACC, growth rates, and profit margins.
- Real-Time Calculations: Instant updates for DCF, Net Present Value (NPV), and cash flow analysis.
- Interactive Dashboard: Intuitive charts and summaries to help visualize your valuation insights.
- Designed for All Levels: A streamlined, user-friendly layout tailored for investors, CFOs, and consultants alike.
How It Works
- Step 1: Download the Excel file.
- Step 2: Review the pre-filled data for Christian Dior SE (CDIPA), including both historical and projected figures.
- Step 3: Modify the key assumptions (highlighted in yellow) according to your analysis.
- Step 4: Monitor the automatic recalculations of Christian Dior's intrinsic value.
- Step 5: Utilize the results for your investment decisions or reporting needs.
Why Opt for This Calculator?
- Designed for Experts: A sophisticated tool utilized by analysts, CFOs, and consultants.
- Accurate Data: Christian Dior SE's historical and projected financials are preloaded for precision.
- Scenario Analysis: Effortlessly test various forecasts and assumptions.
- Clear Results: Instantly calculates intrinsic value, NPV, and essential metrics.
- User-Friendly: Step-by-step guidance leads you through the entire process.
Who Should Benefit from This Product?
- Investors: Accurately assess the fair value of Christian Dior SE (CDIPA) before making investment choices.
- CFOs: Utilize a top-tier DCF model for comprehensive financial reporting and analysis.
- Consultants: Easily customize the template for client valuation reports.
- Entrepreneurs: Acquire insights into financial modeling techniques adopted by leading luxury brands.
- Educators: Employ it as a resource to illustrate various valuation methodologies.
Overview of the Template
- In-Depth DCF Model: A fully editable template featuring extensive valuation calculations.
- Real-Time Data: Historical and projected financial data for Christian Dior SE (CDIPA) already included for your analysis.
- Adjustable Parameters: Modify WACC, growth rates, and tax assumptions to explore various scenarios.
- Comprehensive Financial Statements: Complete annual and quarterly financial breakdowns for enhanced understanding.
- Essential Ratios: Integrated analysis focusing on profitability, efficiency, and leverage metrics.
- Interactive Dashboard with Visual Outputs: Graphs and tables presenting clear, actionable insights.
Disclaimer
All information, articles, and product details provided on this website are for general informational and educational purposes only. We do not claim any ownership over, nor do we intend to infringe upon, any trademarks, copyrights, logos, brand names, or other intellectual property mentioned or depicted on this site. Such intellectual property remains the property of its respective owners, and any references here are made solely for identification or informational purposes, without implying any affiliation, endorsement, or partnership.
We make no representations or warranties, express or implied, regarding the accuracy, completeness, or suitability of any content or products presented. Nothing on this website should be construed as legal, tax, investment, financial, medical, or other professional advice. In addition, no part of this site—including articles or product references—constitutes a solicitation, recommendation, endorsement, advertisement, or offer to buy or sell any securities, franchises, or other financial instruments, particularly in jurisdictions where such activity would be unlawful.
All content is of a general nature and may not address the specific circumstances of any individual or entity. It is not a substitute for professional advice or services. Any actions you take based on the information provided here are strictly at your own risk. You accept full responsibility for any decisions or outcomes arising from your use of this website and agree to release us from any liability in connection with your use of, or reliance upon, the content or products found herein.