
|
Corporation Celanese (CE) DCF Valation |
Entièrement Modifiable: Adapté À Vos Besoins Dans Excel Ou Sheets
Conception Professionnelle: Modèles Fiables Et Conformes Aux Normes Du Secteur
Pré-Construits Pour Une Utilisation Rapide Et Efficace
Compatible MAC/PC, entièrement débloqué
Aucune Expertise N'Est Requise; Facile À Suivre
Celanese Corporation (CE) Bundle
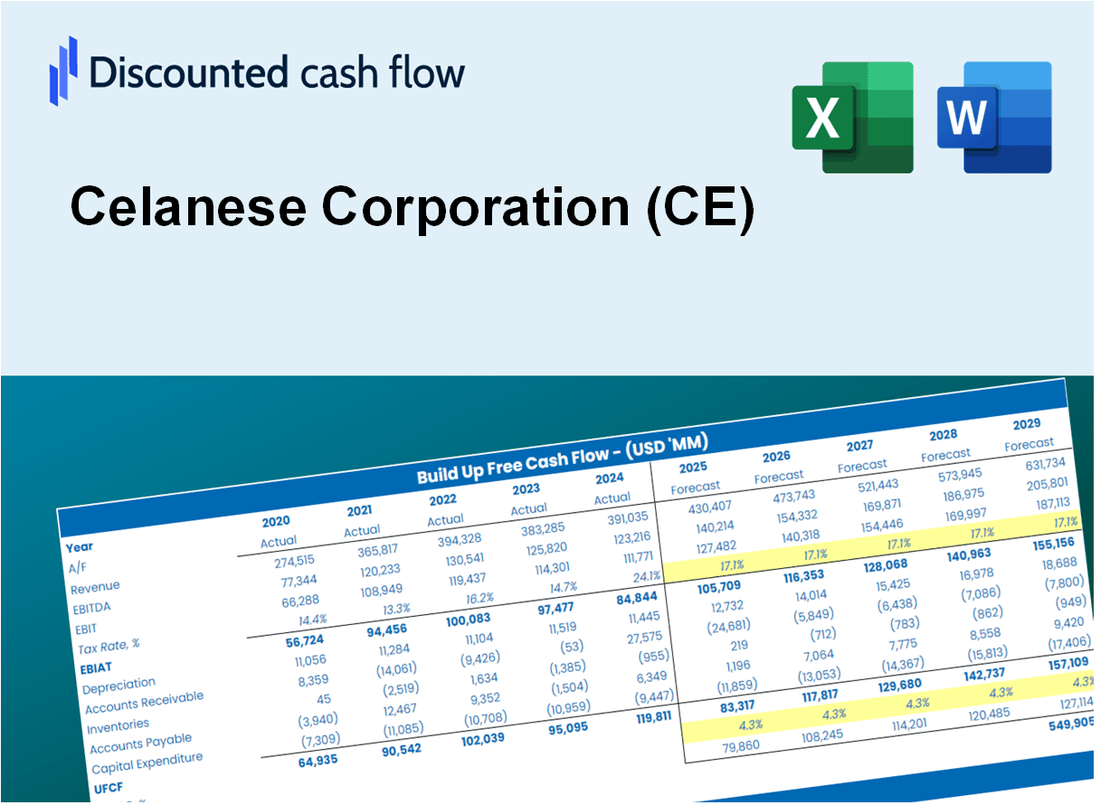
Explorez les perspectives financières de Celanese Corporation avec notre calculatrice DCF conviviale! Entrez vos hypothèses concernant la croissance, les marges et les dépenses pour calculer la valeur intrinsèque de la Celanese Corporation (CE) et éclairer votre stratégie d'investissement.
What You Will Get
- Editable Forecast Inputs: Easily modify assumptions (growth %, margins, WACC) to explore various scenarios.
- Real-World Data: Celanese Corporation’s financial data pre-filled to kickstart your analysis.
- Automatic DCF Outputs: The template computes Net Present Value (NPV) and intrinsic value for you.
- Customizable and Professional: A refined Excel model that adjusts to your valuation requirements.
- Built for Analysts and Investors: Perfect for testing projections, validating strategies, and enhancing efficiency.
Key Features
- Comprehensive DCF Calculator: Offers detailed unlevered and levered DCF valuation models tailored for Celanese Corporation (CE).
- WACC Calculator: Features a pre-built Weighted Average Cost of Capital sheet with adjustable inputs specific to Celanese.
- Customizable Forecast Assumptions: Easily modify growth rates, capital expenditures, and discount rates for accurate projections.
- Integrated Financial Ratios: Evaluate profitability, leverage, and efficiency ratios pertinent to Celanese Corporation (CE).
- Interactive Dashboard and Charts: Visual representations summarize essential valuation metrics for straightforward analysis.
How It Works
- 1. Download the Template: Obtain and open the Excel file featuring Celanese Corporation’s (CE) preloaded data.
- 2. Modify Assumptions: Adjust critical inputs such as growth rates, WACC, and capital expenditures.
- 3. View Results in Real-Time: The DCF model automatically calculates intrinsic value and NPV based on your inputs.
- 4. Explore Scenarios: Evaluate various forecasts to assess different valuation scenarios.
- 5. Present with Assurance: Deliver expert valuation insights to enhance your decision-making process.
Why Choose This Calculator for Celanese Corporation (CE)?
- Accuracy: Utilizes real Celanese financials to ensure reliable data.
- Flexibility: Tailored for users to easily test and adjust inputs as needed.
- Time-Saving: Eliminate the complexities of creating a DCF model from the ground up.
- Professional-Grade: Crafted with the precision and usability expected at the CFO level.
- User-Friendly: Intuitive design makes it accessible for users without extensive financial modeling knowledge.
Who Should Use This Product?
- Investors: Evaluate Celanese Corporation’s (CE) valuation prior to making investment decisions.
- CFOs and Financial Analysts: Enhance valuation methodologies and validate forecasts for Celanese Corporation (CE).
- Startup Founders: Gain insights into the valuation practices of established companies like Celanese Corporation (CE).
- Consultants: Produce comprehensive valuation reports for clients involving Celanese Corporation (CE).
- Students and Educators: Utilize real-time data to learn and teach valuation strategies with a focus on Celanese Corporation (CE).
What the Template Contains
- Preloaded CE Data: Historical and projected financial data, including revenue, EBIT, and capital expenditures.
- DCF and WACC Models: Professional-grade sheets for calculating intrinsic value and Weighted Average Cost of Capital.
- Editable Inputs: Yellow-highlighted cells for adjusting revenue growth, tax rates, and discount rates.
- Financial Statements: Comprehensive annual and quarterly financials for deeper analysis.
- Key Ratios: Profitability, leverage, and efficiency ratios to evaluate performance.
- Dashboard and Charts: Visual summaries of valuation outcomes and assumptions.
Disclaimer
All information, articles, and product details provided on this website are for general informational and educational purposes only. We do not claim any ownership over, nor do we intend to infringe upon, any trademarks, copyrights, logos, brand names, or other intellectual property mentioned or depicted on this site. Such intellectual property remains the property of its respective owners, and any references here are made solely for identification or informational purposes, without implying any affiliation, endorsement, or partnership.
We make no representations or warranties, express or implied, regarding the accuracy, completeness, or suitability of any content or products presented. Nothing on this website should be construed as legal, tax, investment, financial, medical, or other professional advice. In addition, no part of this site—including articles or product references—constitutes a solicitation, recommendation, endorsement, advertisement, or offer to buy or sell any securities, franchises, or other financial instruments, particularly in jurisdictions where such activity would be unlawful.
All content is of a general nature and may not address the specific circumstances of any individual or entity. It is not a substitute for professional advice or services. Any actions you take based on the information provided here are strictly at your own risk. You accept full responsibility for any decisions or outcomes arising from your use of this website and agree to release us from any liability in connection with your use of, or reliance upon, the content or products found herein.