
|
Engrais Chambal et produits chimiques Limited (Chamblfert.NS) Valation DCF |
Entièrement Modifiable: Adapté À Vos Besoins Dans Excel Ou Sheets
Conception Professionnelle: Modèles Fiables Et Conformes Aux Normes Du Secteur
Pré-Construits Pour Une Utilisation Rapide Et Efficace
Compatible MAC/PC, entièrement débloqué
Aucune Expertise N'Est Requise; Facile À Suivre
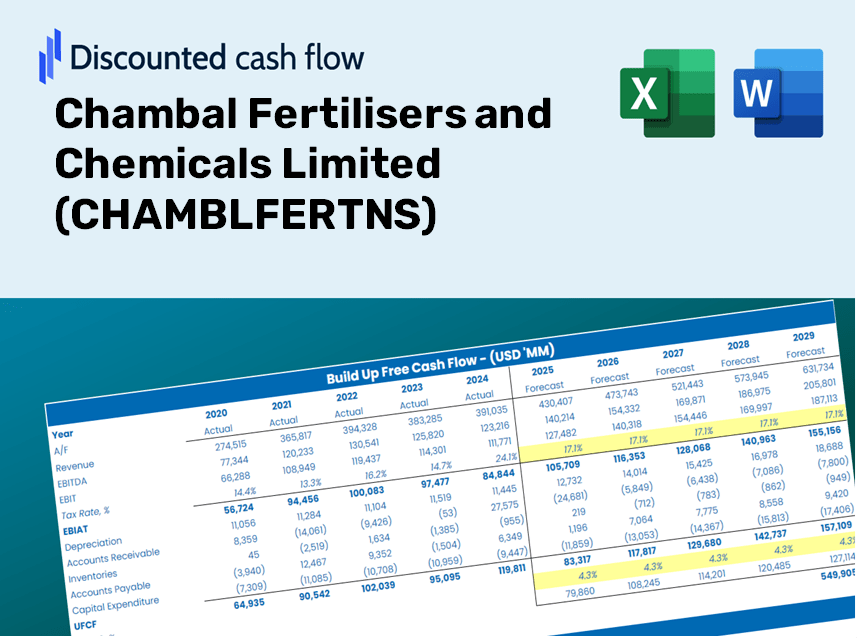
Chambal Fertilisers and Chemicals Limited (CHAMBLFERT.NS) Bundle
Évaluez les engrais Chambal et les perspectives financières de Chemicals Limited avec une précision experte! Cette calculatrice (Chamblfertns) DCF fournit des données financières pré-remplies tout en vous offrant la liberté de modifier la croissance des revenus, le WACC, les marges et d'autres hypothèses critiques pour s'aligner sur vos projections.
Discounted Cash Flow (DCF) - (USD MM)
| Year | AY1 2021 |
AY2 2022 |
AY3 2023 |
AY4 2024 |
AY5 2025 |
FY1 2026 |
FY2 2027 |
FY3 2028 |
FY4 2029 |
FY5 2030 |
|---|---|---|---|---|---|---|---|---|---|---|
| Revenue | 127,190.1 | 160,688.3 | 277,728.1 | 179,664.1 | 166,462.0 | 161,765.0 | 157,200.6 | 152,765.0 | 148,454.5 | 144,265.6 |
| Revenue Growth, % | 0 | 26.34 | 72.84 | -35.31 | -7.35 | -2.82 | -2.82 | -2.82 | -2.82 | -2.82 |
| EBITDA | 24,711.4 | 22,692.1 | 18,981.3 | 20,611.3 | 25,164.9 | 21,668.3 | 21,056.9 | 20,462.8 | 19,885.4 | 19,324.3 |
| EBITDA, % | 19.43 | 14.12 | 6.83 | 11.47 | 15.12 | 13.39 | 13.39 | 13.39 | 13.39 | 13.39 |
| Depreciation | 2,827.6 | 2,932.6 | 3,020.2 | 3,070.6 | 3,241.0 | 2,844.4 | 2,764.1 | 2,686.1 | 2,610.3 | 2,536.7 |
| Depreciation, % | 2.22 | 1.83 | 1.09 | 1.71 | 1.95 | 1.76 | 1.76 | 1.76 | 1.76 | 1.76 |
| EBIT | 21,883.8 | 19,759.5 | 15,961.1 | 17,540.7 | 21,923.9 | 18,823.9 | 18,292.8 | 17,776.6 | 17,275.0 | 16,787.6 |
| EBIT, % | 17.21 | 12.3 | 5.75 | 9.76 | 13.17 | 11.64 | 11.64 | 11.64 | 11.64 | 11.64 |
| Total Cash | 8,924.0 | 5,367.6 | 18,760.6 | 20,458.3 | 10,645.6 | 11,289.2 | 10,970.7 | 10,661.1 | 10,360.3 | 10,068.0 |
| Total Cash, percent | .0 | .0 | .0 | .0 | .0 | .0 | .0 | .0 | .0 | .0 |
| Account Receivables | 13,318.4 | 21,788.1 | 18,739.8 | 3,046.6 | 3,679.4 | 11,221.3 | 10,904.7 | 10,597.0 | 10,298.0 | 10,007.4 |
| Account Receivables, % | 10.47 | 13.56 | 6.75 | 1.7 | 2.21 | 6.94 | 6.94 | 6.94 | 6.94 | 6.94 |
| Inventories | 7,891.4 | 31,232.1 | 13,738.3 | 12,546.6 | 18,022.9 | 15,658.2 | 15,216.4 | 14,787.0 | 14,369.8 | 13,964.3 |
| Inventories, % | 6.2 | 19.44 | 4.95 | 6.98 | 10.83 | 9.68 | 9.68 | 9.68 | 9.68 | 9.68 |
| Accounts Payable | 3,890.4 | 12,115.4 | 12,115.4 | 7,938.3 | 6,302.7 | 7,494.7 | 7,283.2 | 7,077.7 | 6,878.0 | 6,683.9 |
| Accounts Payable, % | 3.06 | 7.54 | 4.36 | 4.42 | 3.79 | 4.63 | 4.63 | 4.63 | 4.63 | 4.63 |
| Capital Expenditure | -2,357.4 | -1,786.2 | -1,977.4 | -6,128.0 | -5,718.4 | -3,404.5 | -3,308.5 | -3,215.1 | -3,124.4 | -3,036.2 |
| Capital Expenditure, % | -1.85 | -1.11 | -0.71199 | -3.41 | -3.44 | -2.1 | -2.1 | -2.1 | -2.1 | -2.1 |
| Tax Rate, % | 32.72 | 32.72 | 32.72 | 32.72 | 32.72 | 32.72 | 32.72 | 32.72 | 32.72 | 32.72 |
| EBITAT | 15,347.3 | 13,870.2 | 11,655.0 | 11,859.4 | 14,750.4 | 13,110.4 | 12,740.5 | 12,381.0 | 12,031.6 | 11,692.2 |
| Depreciation | ||||||||||
| Changes in Account Receivables | ||||||||||
| Changes in Inventories | ||||||||||
| Changes in Accounts Payable | ||||||||||
| Capital Expenditure | ||||||||||
| UFCF | -1,501.9 | -8,568.8 | 33,239.9 | 21,509.8 | 4,528.3 | 8,565.0 | 12,743.1 | 12,383.5 | 12,034.1 | 11,694.5 |
| WACC, % | 5.73 | 5.73 | 5.74 | 5.72 | 5.72 | 5.73 | 5.73 | 5.73 | 5.73 | 5.73 |
| PV UFCF | ||||||||||
| SUM PV UFCF | 48,461.9 | |||||||||
| Long Term Growth Rate, % | 2.00 | |||||||||
| Free cash flow (T + 1) | 11,928 | |||||||||
| Terminal Value | 320,020 | |||||||||
| Present Terminal Value | 242,236 | |||||||||
| Enterprise Value | 290,698 | |||||||||
| Net Debt | -1,376 | |||||||||
| Equity Value | 292,074 | |||||||||
| Diluted Shares Outstanding, MM | 401 | |||||||||
| Equity Value Per Share | 729.00 |
What You Will Receive
- Authentic Chambal Data: Preloaded financials – encompassing revenue to EBIT – derived from actual and projected statistics.
- Comprehensive Customization: Modify all key parameters (yellow cells) such as WACC, growth %, and tax rates.
- Real-Time Valuation Updates: Automatic recalculations to assess the effects of changes on Chambal's fair value.
- Flexible Excel Template: Designed for quick adjustments, scenario analysis, and thorough forecasts.
- Efficient and Precise: Bypass the need to build models from the ground up while ensuring accuracy and adaptability.
Key Features
- Customizable Performance Metrics: Adjust essential factors such as revenue growth, EBITDA margin, and capital expenditures to fit your analysis.
- Instant DCF Valuation: Quickly computes intrinsic value, net present value (NPV), and other essential financial outputs.
- High-Precision Accuracy: Leverages Chambal Fertilisers' real-world financial data for credible valuation results.
- Effortless Scenario Testing: Easily evaluate various assumptions and assess their impact on projected outcomes.
- Efficiency Booster: Streamlines the valuation process, removing the need for complex model creation from the ground up.
How It Works
- Step 1: Download the Excel file.
- Step 2: Examine the pre-filled data for Chambal Fertilisers and Chemicals Limited (CHAMBLFERTNS), including historical and forecast information.
- Step 3: Modify key assumptions (highlighted in yellow) according to your analysis.
- Step 4: Observe automatic recalculations for the intrinsic value of Chambal Fertilisers and Chemicals Limited (CHAMBLFERTNS).
- Step 5: Utilize the results for making investment choices or for reporting purposes.
Why Choose This Calculator for Chambal Fertilisers and Chemicals Limited (CHAMBLFERTNS)?
- Designed for Experts: A sophisticated tool utilized by finance professionals, analysts, and industry consultants.
- Accurate Financial Insights: Preloaded historical and forecasted data for Chambal Fertilisers to ensure precision.
- Forecast Scenario Analysis: Effortlessly test various projections and assumptions.
- Comprehensive Outputs: Automatically generates intrinsic value, NPV, and essential financial metrics.
- User-Friendly Interface: Step-by-step guidance makes the calculation process straightforward.
Who Should Consider This Product?
- Investors: Accurately assess the fair value of Chambal Fertilisers and Chemicals Limited (CHAMBLFERTNS) prior to making investment choices.
- CFOs: Utilize a high-quality DCF model for comprehensive financial reporting and analysis.
- Consultants: Efficiently modify the template for client valuation reports.
- Entrepreneurs: Learn from the financial modeling techniques employed by leading companies in the industry.
- Educators: Implement it as a resource to teach valuation methodologies effectively.
Contents of the Template
- Pre-Populated Data: Features Chambal Fertilisers and Chemicals Limited's historical financial performance and forecasts.
- Discounted Cash Flow Model: A customizable DCF valuation model with automated calculations.
- Weighted Average Cost of Capital (WACC): A specialized sheet for computing WACC with user-defined inputs.
- Key Financial Ratios: Assessment of Chambal's profitability, operational efficiency, and financial leverage.
- Customizable Inputs: Easily modify projections for revenue growth, margins, and tax rates.
- Comprehensive Dashboard: Visualizations and tables that highlight essential valuation metrics.
Disclaimer
All information, articles, and product details provided on this website are for general informational and educational purposes only. We do not claim any ownership over, nor do we intend to infringe upon, any trademarks, copyrights, logos, brand names, or other intellectual property mentioned or depicted on this site. Such intellectual property remains the property of its respective owners, and any references here are made solely for identification or informational purposes, without implying any affiliation, endorsement, or partnership.
We make no representations or warranties, express or implied, regarding the accuracy, completeness, or suitability of any content or products presented. Nothing on this website should be construed as legal, tax, investment, financial, medical, or other professional advice. In addition, no part of this site—including articles or product references—constitutes a solicitation, recommendation, endorsement, advertisement, or offer to buy or sell any securities, franchises, or other financial instruments, particularly in jurisdictions where such activity would be unlawful.
All content is of a general nature and may not address the specific circumstances of any individual or entity. It is not a substitute for professional advice or services. Any actions you take based on the information provided here are strictly at your own risk. You accept full responsibility for any decisions or outcomes arising from your use of this website and agree to release us from any liability in connection with your use of, or reliance upon, the content or products found herein.