
|
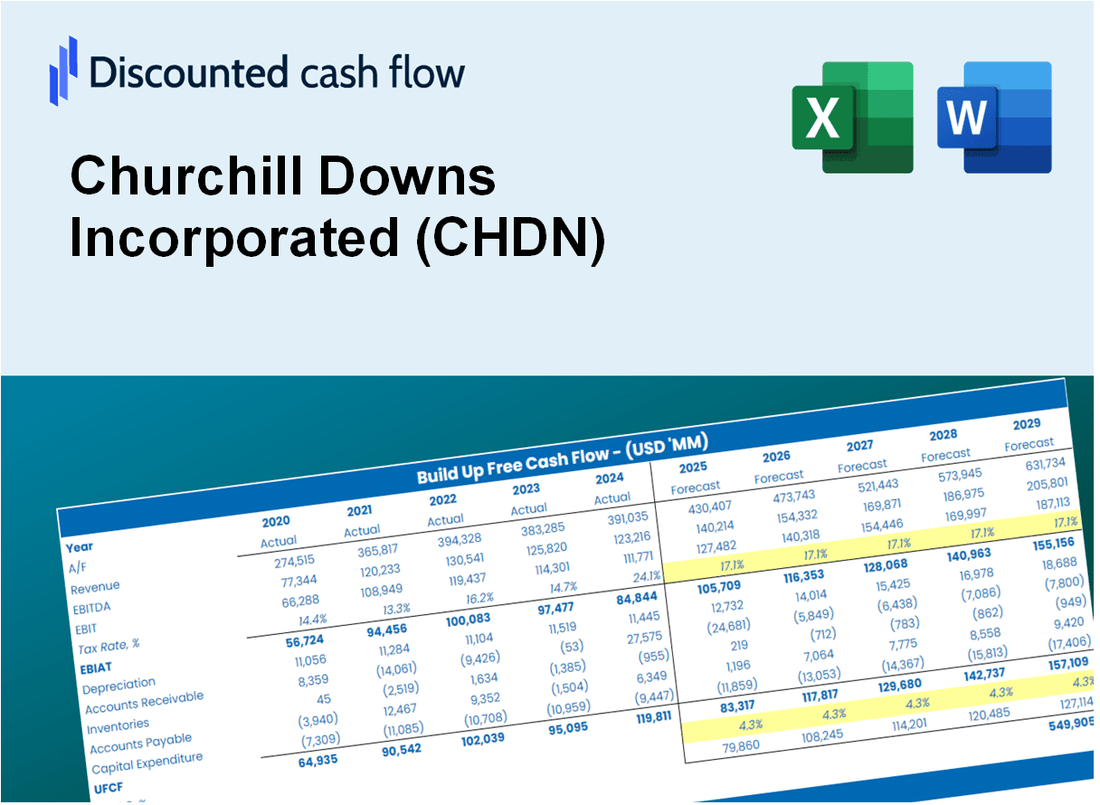
Churchill Downs Incorporated (CHDN) DCF Valuation |
Entièrement Modifiable: Adapté À Vos Besoins Dans Excel Ou Sheets
Conception Professionnelle: Modèles Fiables Et Conformes Aux Normes Du Secteur
Pré-Construits Pour Une Utilisation Rapide Et Efficace
Compatible MAC/PC, entièrement débloqué
Aucune Expertise N'Est Requise; Facile À Suivre
Churchill Downs Incorporated (CHDN) Bundle
Si vous êtes un investisseur ou un analyste, cette calculatrice DCF de Churchill Downs Incorporated (CHDN) est votre ressource incontournable pour une évaluation précise. Avec les données réelles de Churchill Downs Incorporated déjà chargées, vous pouvez ajuster les prévisions et observer instantanément les effets.
What You Will Get
- Real CHDN Financial Data: Pre-filled with Churchill Downs Incorporated’s historical and projected data for precise analysis.
- Fully Editable Template: Modify key inputs like revenue growth, WACC, and EBITDA % with ease.
- Automatic Calculations: See CHDN’s intrinsic value update instantly based on your changes.
- Professional Valuation Tool: Designed for investors, analysts, and consultants seeking accurate DCF results.
- User-Friendly Design: Simple structure and clear instructions for all experience levels.
Key Features
- Accurate Churchill Downs Financials: Gain access to reliable pre-loaded historical data and future forecasts.
- Adjustable Forecast Parameters: Modify highlighted cells for WACC, growth rates, and profit margins.
- Real-Time Calculations: Automatic updates for DCF, Net Present Value (NPV), and cash flow analysis.
- Interactive Dashboard: Clear and informative charts and summaries to help visualize your valuation outcomes.
- Suitable for All Levels: A straightforward, user-friendly layout designed for investors, CFOs, and consultants alike.
How It Works
- Step 1: Download the Excel file.
- Step 2: Review pre-entered Churchill Downs Incorporated (CHDN) data (historical and projected).
- Step 3: Adjust key assumptions (yellow cells) based on your analysis.
- Step 4: View automatic recalculations for Churchill Downs Incorporated’s intrinsic value.
- Step 5: Use the outputs for investment decisions or reporting.
Why Choose Churchill Downs Incorporated (CHDN)?
- Rich History: A legacy of excellence in the racing and gaming industry since 1875.
- Innovative Experiences: Offering cutting-edge technology and entertainment options for all guests.
- Community Commitment: Actively supports local initiatives and charitable organizations.
- Expert Leadership: Guided by a team of industry veterans dedicated to growth and sustainability.
- Exceptional Returns: Proven track record of delivering value to shareholders and stakeholders alike.
Who Should Use This Product?
- Investors: Evaluate Churchill Downs Incorporated’s (CHDN) market performance before making investment decisions.
- CFOs and Financial Analysts: Optimize valuation methodologies and assess financial forecasts for (CHDN).
- Startup Founders: Discover how established companies like Churchill Downs are appraised in the market.
- Consultants: Provide expert valuation analysis and reports for clients considering (CHDN).
- Students and Educators: Utilize real-time data to teach and practice valuation strategies using (CHDN).
What the Template Contains
- Historical Data: Includes Churchill Downs Incorporated’s (CHDN) past financials and baseline forecasts.
- DCF and Levered DCF Models: Detailed templates to calculate Churchill Downs Incorporated’s (CHDN) intrinsic value.
- WACC Sheet: Pre-built calculations for Weighted Average Cost of Capital specific to Churchill Downs Incorporated (CHDN).
- Editable Inputs: Modify key drivers like growth rates, EBITDA %, and CAPEX assumptions for Churchill Downs Incorporated (CHDN).
- Quarterly and Annual Statements: A complete breakdown of Churchill Downs Incorporated’s (CHDN) financials.
- Interactive Dashboard: Visualize valuation results and projections for Churchill Downs Incorporated (CHDN) dynamically.
Disclaimer
All information, articles, and product details provided on this website are for general informational and educational purposes only. We do not claim any ownership over, nor do we intend to infringe upon, any trademarks, copyrights, logos, brand names, or other intellectual property mentioned or depicted on this site. Such intellectual property remains the property of its respective owners, and any references here are made solely for identification or informational purposes, without implying any affiliation, endorsement, or partnership.
We make no representations or warranties, express or implied, regarding the accuracy, completeness, or suitability of any content or products presented. Nothing on this website should be construed as legal, tax, investment, financial, medical, or other professional advice. In addition, no part of this site—including articles or product references—constitutes a solicitation, recommendation, endorsement, advertisement, or offer to buy or sell any securities, franchises, or other financial instruments, particularly in jurisdictions where such activity would be unlawful.
All content is of a general nature and may not address the specific circumstances of any individual or entity. It is not a substitute for professional advice or services. Any actions you take based on the information provided here are strictly at your own risk. You accept full responsibility for any decisions or outcomes arising from your use of this website and agree to release us from any liability in connection with your use of, or reliance upon, the content or products found herein.