
|
CELLEBRITE DI LTD. (CLBT) Évaluation DCF |
Entièrement Modifiable: Adapté À Vos Besoins Dans Excel Ou Sheets
Conception Professionnelle: Modèles Fiables Et Conformes Aux Normes Du Secteur
Pré-Construits Pour Une Utilisation Rapide Et Efficace
Compatible MAC/PC, entièrement débloqué
Aucune Expertise N'Est Requise; Facile À Suivre
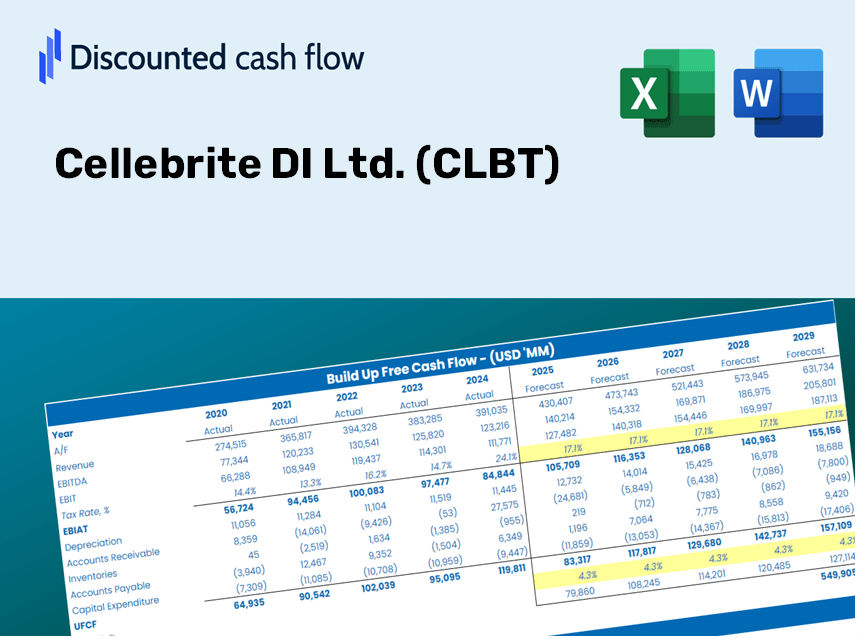
Cellebrite DI Ltd. (CLBT) Bundle
Explorez les perspectives financières de Cellebrite Di Ltd. (CLBT) avec notre calculatrice DCF conviviale! Entrez vos hypothèses de croissance, de marges et de dépenses pour calculer la valeur intrinsèque de Cellebrite Di Ltd. (CLBT) et affiner votre approche d'investissement.
Discounted Cash Flow (DCF) - (USD MM)
| Year | AY1 2020 |
AY2 2021 |
AY3 2022 |
AY4 2023 |
AY5 2024 |
FY1 2025 |
FY2 2026 |
FY3 2027 |
FY4 2028 |
FY5 2029 |
|---|---|---|---|---|---|---|---|---|---|---|
| Revenue | 194.9 | 246.2 | 270.7 | 325.1 | 401.2 | 481.2 | 577.2 | 692.3 | 830.4 | 996.0 |
| Revenue Growth, % | 0 | 26.34 | 9.91 | 20.12 | 23.41 | 19.94 | 19.94 | 19.94 | 19.94 | 19.94 |
| EBITDA | 17.3 | 89.5 | 130.1 | -64.8 | 67.5 | 86.8 | 104.1 | 124.8 | 149.7 | 179.6 |
| EBITDA, % | 8.86 | 36.33 | 48.07 | -19.93 | 16.83 | 18.03 | 18.03 | 18.03 | 18.03 | 18.03 |
| Depreciation | 5.9 | 7.0 | 9.2 | 10.0 | 10.6 | 14.4 | 17.3 | 20.7 | 24.9 | 29.8 |
| Depreciation, % | 3.02 | 2.85 | 3.4 | 3.08 | 2.64 | 3 | 3 | 3 | 3 | 3 |
| EBIT | 11.4 | 82.5 | 120.9 | -74.8 | 56.9 | 72.4 | 86.8 | 104.1 | 124.9 | 149.8 |
| EBIT, % | 5.85 | 33.49 | 44.67 | -23.01 | 14.18 | 15.04 | 15.04 | 15.04 | 15.04 | 15.04 |
| Total Cash | 237.6 | 181.6 | 183.6 | 302.9 | 447.2 | 418.4 | 501.9 | 602.0 | 722.0 | 866.0 |
| Total Cash, percent | .0 | .0 | .0 | .0 | .0 | .0 | .0 | .0 | .0 | .0 |
| Account Receivables | 66.3 | 67.5 | 78.8 | 77.3 | 82.4 | 129.8 | 155.7 | 186.7 | 223.9 | 268.6 |
| Account Receivables, % | 34.03 | 27.41 | 29.1 | 23.77 | 20.53 | 26.97 | 26.97 | 26.97 | 26.97 | 26.97 |
| Inventories | 4.8 | 6.5 | 10.2 | 9.9 | 8.9 | 13.6 | 16.3 | 19.6 | 23.5 | 28.1 |
| Inventories, % | 2.44 | 2.64 | 3.76 | 3.06 | 2.23 | 2.83 | 2.83 | 2.83 | 2.83 | 2.83 |
| Accounts Payable | 4.7 | 9.5 | 4.6 | 8.3 | 11.1 | 12.8 | 15.4 | 18.4 | 22.1 | 26.5 |
| Accounts Payable, % | 2.43 | 3.88 | 1.7 | 2.55 | 2.76 | 2.66 | 2.66 | 2.66 | 2.66 | 2.66 |
| Capital Expenditure | -6.2 | -8.1 | -9.1 | -7.9 | -10.6 | -14.3 | -17.2 | -20.6 | -24.7 | -29.7 |
| Capital Expenditure, % | -3.17 | -3.29 | -3.36 | -2.44 | -2.64 | -2.98 | -2.98 | -2.98 | -2.98 | -2.98 |
| Tax Rate, % | -2.54 | -2.54 | -2.54 | -2.54 | -2.54 | -2.54 | -2.54 | -2.54 | -2.54 | -2.54 |
| EBITAT | 5.8 | 71.5 | 121.0 | -80.3 | 58.4 | 63.3 | 75.9 | 91.1 | 109.2 | 131.0 |
| Depreciation | ||||||||||
| Changes in Account Receivables | ||||||||||
| Changes in Inventories | ||||||||||
| Changes in Accounts Payable | ||||||||||
| Capital Expenditure | ||||||||||
| UFCF | -60.9 | 72.3 | 101.2 | -72.8 | 57.1 | 13.0 | 50.0 | 60.0 | 71.9 | 86.3 |
| WACC, % | 14.35 | 17.6 | 18.8 | 18.8 | 18.8 | 17.67 | 17.67 | 17.67 | 17.67 | 17.67 |
| PV UFCF | ||||||||||
| SUM PV UFCF | 159.7 | |||||||||
| Long Term Growth Rate, % | 2.00 | |||||||||
| Free cash flow (T + 1) | 88 | |||||||||
| Terminal Value | 562 | |||||||||
| Present Terminal Value | 249 | |||||||||
| Enterprise Value | 409 | |||||||||
| Net Debt | -181 | |||||||||
| Equity Value | 589 | |||||||||
| Diluted Shares Outstanding, MM | 209 | |||||||||
| Equity Value Per Share | 2.81 |
What You Will Receive
- Authentic CLBT Financial Data: Pre-loaded with Cellebrite's historical and projected metrics for accurate analysis.
- Completely Customizable Template: Easily adjust key parameters such as revenue growth, WACC, and EBITDA margin.
- Instantaneous Calculations: Watch Cellebrite’s intrinsic value recalibrate in real-time as you make modifications.
- Expert Valuation Tool: Tailored for investors, analysts, and consultants aiming for precise DCF outcomes.
- Intuitive Interface: Simplistic layout and straightforward instructions suitable for users at any skill level.
Key Features
- Customizable Forecast Inputs: Adjust essential factors such as revenue growth, EBITDA margin, and capital expenditures.
- Instant DCF Valuation: Quickly computes intrinsic value, NPV, and other key metrics.
- Industry-Leading Precision: Utilizes real-world financial data from Cellebrite DI Ltd. (CLBT) for accurate valuation results.
- Effortless Scenario Analysis: Easily explore various assumptions and evaluate their impact on outcomes.
- Efficiency Booster: Avoid the hassle of constructing intricate valuation models from the ground up.
How It Functions
- Download the Template: Gain immediate access to the Excel-based CLBT DCF Calculator.
- Input Your Assumptions: Modify the yellow-highlighted cells for growth rates, WACC, profit margins, and more.
- Instant Calculations: The model automatically refreshes Cellebrite's intrinsic value.
- Test Scenarios: Experiment with various assumptions to assess potential changes in valuation.
- Analyze and Decide: Utilize the findings to inform your investment or financial assessments.
Why Opt for This Calculator?
- All-in-One Solution: Combines DCF, WACC, and financial ratio analyses into a single tool.
- Flexible Inputs: Modify the yellow-highlighted cells to explore different scenarios.
- In-Depth Analysis: Automatically computes the intrinsic value and Net Present Value for Cellebrite DI Ltd. (CLBT).
- Ready-to-Use Data: Features historical and projected data for more reliable starting points.
- High-Quality Standards: Perfect for financial analysts, investors, and business consultants.
Who Can Benefit from Cellebrite DI Ltd. (CLBT)?
- Law Enforcement Professionals: Utilize advanced digital forensic tools to enhance investigations.
- Cybersecurity Experts: Integrate cutting-edge solutions into security protocols and assessments.
- Legal Practitioners: Analyze digital evidence effectively to support litigation cases.
- Academics and Researchers: Explore innovative methodologies and technologies in digital investigation research.
- Corporate Security Teams: Understand how to protect sensitive data by learning from large-scale digital forensic applications.
What the Template Contains
- Preloaded CLBT Data: Historical and projected financial data, including revenue, EBIT, and capital expenditures.
- DCF and WACC Models: Professional-grade spreadsheets for calculating intrinsic value and Weighted Average Cost of Capital.
- Editable Inputs: Yellow-highlighted cells allowing for adjustments to revenue growth, tax rates, and discount rates.
- Financial Statements: Detailed annual and quarterly financial statements for thorough analysis.
- Key Ratios: Metrics for profitability, leverage, and efficiency to assess performance.
- Dashboard and Charts: Visual representations of valuation outcomes and underlying assumptions.
Disclaimer
All information, articles, and product details provided on this website are for general informational and educational purposes only. We do not claim any ownership over, nor do we intend to infringe upon, any trademarks, copyrights, logos, brand names, or other intellectual property mentioned or depicted on this site. Such intellectual property remains the property of its respective owners, and any references here are made solely for identification or informational purposes, without implying any affiliation, endorsement, or partnership.
We make no representations or warranties, express or implied, regarding the accuracy, completeness, or suitability of any content or products presented. Nothing on this website should be construed as legal, tax, investment, financial, medical, or other professional advice. In addition, no part of this site—including articles or product references—constitutes a solicitation, recommendation, endorsement, advertisement, or offer to buy or sell any securities, franchises, or other financial instruments, particularly in jurisdictions where such activity would be unlawful.
All content is of a general nature and may not address the specific circumstances of any individual or entity. It is not a substitute for professional advice or services. Any actions you take based on the information provided here are strictly at your own risk. You accept full responsibility for any decisions or outcomes arising from your use of this website and agree to release us from any liability in connection with your use of, or reliance upon, the content or products found herein.