
|
Clene Inc. (CLNN) Évaluation DCF |
Entièrement Modifiable: Adapté À Vos Besoins Dans Excel Ou Sheets
Conception Professionnelle: Modèles Fiables Et Conformes Aux Normes Du Secteur
Pré-Construits Pour Une Utilisation Rapide Et Efficace
Compatible MAC/PC, entièrement débloqué
Aucune Expertise N'Est Requise; Facile À Suivre
Clene Inc. (CLNN) Bundle
Améliorez votre stratégie d'investissement avec la calculatrice DCF Clene Inc. (CLNN)! Utiliser les données financières de Clene réelles, ajuster les projections et les dépenses de croissance et observer instantanément comment ces modifications influencent la valeur intrinsèque de Clene Inc. (CLNN).
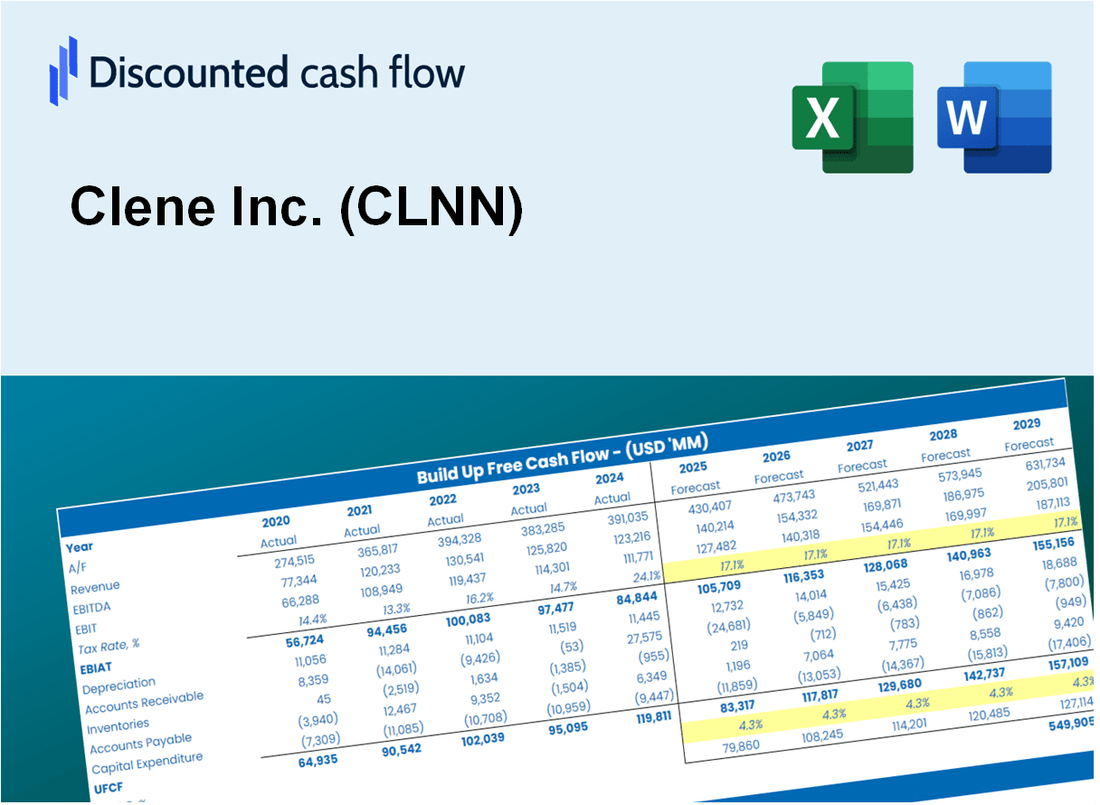
Discounted Cash Flow (DCF) - (USD MM)
| Year | AY1 2020 |
AY2 2021 |
AY3 2022 |
AY4 2023 |
AY5 2024 |
FY1 2025 |
FY2 2026 |
FY3 2027 |
FY4 2028 |
FY5 2029 |
|---|---|---|---|---|---|---|---|---|---|---|
| Revenue | .2 | .7 | .5 | .7 | .3 | .4 | .4 | .5 | .6 | .7 |
| Revenue Growth, % | 0 | 250.97 | -34.58 | 38.27 | -47.71 | 14 | 14 | 14 | 14 | 14 |
| EBITDA | -17.0 | -8.3 | -25.6 | -43.2 | -33.7 | -.4 | -.4 | -.5 | -.6 | -.7 |
| EBITDA, % | -8232.04 | -1153.94 | -5412.9 | -6611.77 | -9851.17 | -100 | -100 | -100 | -100 | -100 |
| Depreciation | 1.0 | 1.0 | 1.0 | 1.7 | 1.6 | .4 | .4 | .5 | .6 | .7 |
| Depreciation, % | 467.48 | 132.09 | 215.43 | 260.7 | 480.99 | 100 | 100 | 100 | 100 | 100 |
| EBIT | -17.9 | -9.3 | -26.6 | -44.9 | -35.3 | -.4 | -.4 | -.5 | -.6 | -.7 |
| EBIT, % | -8699.51 | -1286.03 | -5628.33 | -6872.48 | -10332.16 | -100 | -100 | -100 | -100 | -100 |
| Total Cash | 59.3 | 50.3 | 23.3 | 35.0 | 12.2 | .4 | .4 | .5 | .6 | .7 |
| Total Cash, percent | .0 | .0 | .0 | .0 | .0 | .0 | .0 | .0 | .0 | .0 |
| Account Receivables | 2.2 | 1.6 | 3.0 | 1.3 | .4 | .4 | .4 | .5 | .6 | .7 |
| Account Receivables, % | 1052.91 | 223.1 | 627.06 | 204.59 | 114.33 | 100 | 100 | 100 | 100 | 100 |
| Inventories | .2 | .0 | .0 | .0 | .1 | .1 | .1 | .1 | .2 | .2 |
| Inventories, % | 92.72 | 5.67 | 9.09 | 5.66 | 19.88 | 26.6 | 26.6 | 26.6 | 26.6 | 26.6 |
| Accounts Payable | 1.1 | 1.9 | 3.0 | 1.5 | 1.2 | .4 | .4 | .5 | .6 | .7 |
| Accounts Payable, % | 545.63 | 265.98 | 637.21 | 229.97 | 362.57 | 100 | 100 | 100 | 100 | 100 |
| Capital Expenditure | -.4 | -1.3 | -5.2 | -.3 | .0 | -.3 | -.3 | -.4 | -.4 | -.5 |
| Capital Expenditure, % | -187.86 | -184.23 | -1094.93 | -50.46 | -4.39 | -70.97 | -70.97 | -70.97 | -70.97 | -70.97 |
| Tax Rate, % | 0 | 0 | 0 | 0 | 0 | 0 | 0 | 0 | 0 | 0 |
| EBITAT | -18.3 | -8.9 | -26.6 | -44.9 | -35.3 | -.4 | -.4 | -.5 | -.6 | -.7 |
| Depreciation | ||||||||||
| Changes in Account Receivables | ||||||||||
| Changes in Inventories | ||||||||||
| Changes in Accounts Payable | ||||||||||
| Capital Expenditure | ||||||||||
| UFCF | -19.0 | -7.8 | -31.0 | -43.4 | -33.1 | -1.2 | -.3 | -.4 | -.4 | -.5 |
| WACC, % | 10.54 | 10.33 | 10.54 | 10.54 | 10.54 | 10.5 | 10.5 | 10.5 | 10.5 | 10.5 |
| PV UFCF | ||||||||||
| SUM PV UFCF | -2.2 | |||||||||
| Long Term Growth Rate, % | 2.00 | |||||||||
| Free cash flow (T + 1) | 0 | |||||||||
| Terminal Value | -6 | |||||||||
| Present Terminal Value | -4 | |||||||||
| Enterprise Value | -6 | |||||||||
| Net Debt | 9 | |||||||||
| Equity Value | -14 | |||||||||
| Diluted Shares Outstanding, MM | 7 | |||||||||
| Equity Value Per Share | -2.07 |
What You Will Receive
- Pre-Filled Financial Model: Clene Inc.’s actual data allows for accurate DCF valuation.
- Comprehensive Forecast Control: Modify revenue growth, margins, WACC, and other essential factors.
- Real-Time Calculations: Automatic updates provide immediate feedback as you adjust parameters.
- Professional-Grade Template: A polished Excel file crafted for high-quality valuation.
- Flexible and Reusable: Designed for adaptability, enabling repeated use for in-depth forecasts.
Key Features
- Comprehensive Clene Financials: Gain access to precise pre-loaded historical data and future projections for Clene Inc. (CLNN).
- Adjustable Forecast Parameters: Modify highlighted cells such as WACC, growth rates, and margins to tailor your analysis.
- Real-Time Calculations: Benefit from automatic updates to DCF, Net Present Value (NPV), and cash flow assessments.
- Interactive Dashboard: Utilize user-friendly charts and summaries to clearly present your valuation outcomes.
- Designed for All Skill Levels: An intuitive framework suitable for investors, CFOs, and consultants alike.
How It Works
- Step 1: Download the Excel file.
- Step 2: Review pre-entered Clene Inc. (CLNN) data (historical and projected).
- Step 3: Adjust key assumptions (yellow cells) based on your analysis.
- Step 4: View automatic recalculations for Clene Inc.'s intrinsic value.
- Step 5: Use the outputs for investment decisions or reporting.
Why Choose This Calculator?
- Accurate Data: Real Clene Inc. (CLNN) financials ensure reliable valuation results.
- Customizable: Adjust key parameters like growth rates, WACC, and tax rates to match your projections.
- Time-Saving: Pre-built calculations eliminate the need to start from scratch.
- Professional-Grade Tool: Designed for investors, analysts, and consultants.
- User-Friendly: Intuitive layout and step-by-step instructions make it easy for all users.
Who Should Use Clene Inc. (CLNN)?
- Healthcare Students: Explore innovative drug development processes and apply your knowledge to real-world scenarios.
- Researchers: Utilize cutting-edge data in studies related to neurodegenerative diseases.
- Investors: Evaluate your investment strategies and analyze the potential of Clene Inc. (CLNN) in the biotech sector.
- Pharmaceutical Analysts: Enhance your analysis with a comprehensive understanding of Clene's clinical trial outcomes.
- Entrepreneurs: Discover how emerging biotech companies like Clene Inc. (CLNN) navigate the market landscape.
What the Template Contains
- Pre-Filled DCF Model: Clene Inc.’s (CLNN) financial data preloaded for immediate use.
- WACC Calculator: Detailed calculations for Weighted Average Cost of Capital.
- Financial Ratios: Evaluate Clene Inc.’s (CLNN) profitability, leverage, and efficiency.
- Editable Inputs: Change assumptions such as growth, margins, and CAPEX to fit your scenarios.
- Financial Statements: Annual and quarterly reports to support detailed analysis.
- Interactive Dashboard: Easily visualize key valuation metrics and results.
Disclaimer
All information, articles, and product details provided on this website are for general informational and educational purposes only. We do not claim any ownership over, nor do we intend to infringe upon, any trademarks, copyrights, logos, brand names, or other intellectual property mentioned or depicted on this site. Such intellectual property remains the property of its respective owners, and any references here are made solely for identification or informational purposes, without implying any affiliation, endorsement, or partnership.
We make no representations or warranties, express or implied, regarding the accuracy, completeness, or suitability of any content or products presented. Nothing on this website should be construed as legal, tax, investment, financial, medical, or other professional advice. In addition, no part of this site—including articles or product references—constitutes a solicitation, recommendation, endorsement, advertisement, or offer to buy or sell any securities, franchises, or other financial instruments, particularly in jurisdictions where such activity would be unlawful.
All content is of a general nature and may not address the specific circumstances of any individual or entity. It is not a substitute for professional advice or services. Any actions you take based on the information provided here are strictly at your own risk. You accept full responsibility for any decisions or outcomes arising from your use of this website and agree to release us from any liability in connection with your use of, or reliance upon, the content or products found herein.