
|
Clariver PLC (CLVT) Valation DCF |
Entièrement Modifiable: Adapté À Vos Besoins Dans Excel Ou Sheets
Conception Professionnelle: Modèles Fiables Et Conformes Aux Normes Du Secteur
Pré-Construits Pour Une Utilisation Rapide Et Efficace
Compatible MAC/PC, entièrement débloqué
Aucune Expertise N'Est Requise; Facile À Suivre
Clarivate Plc (CLVT) Bundle
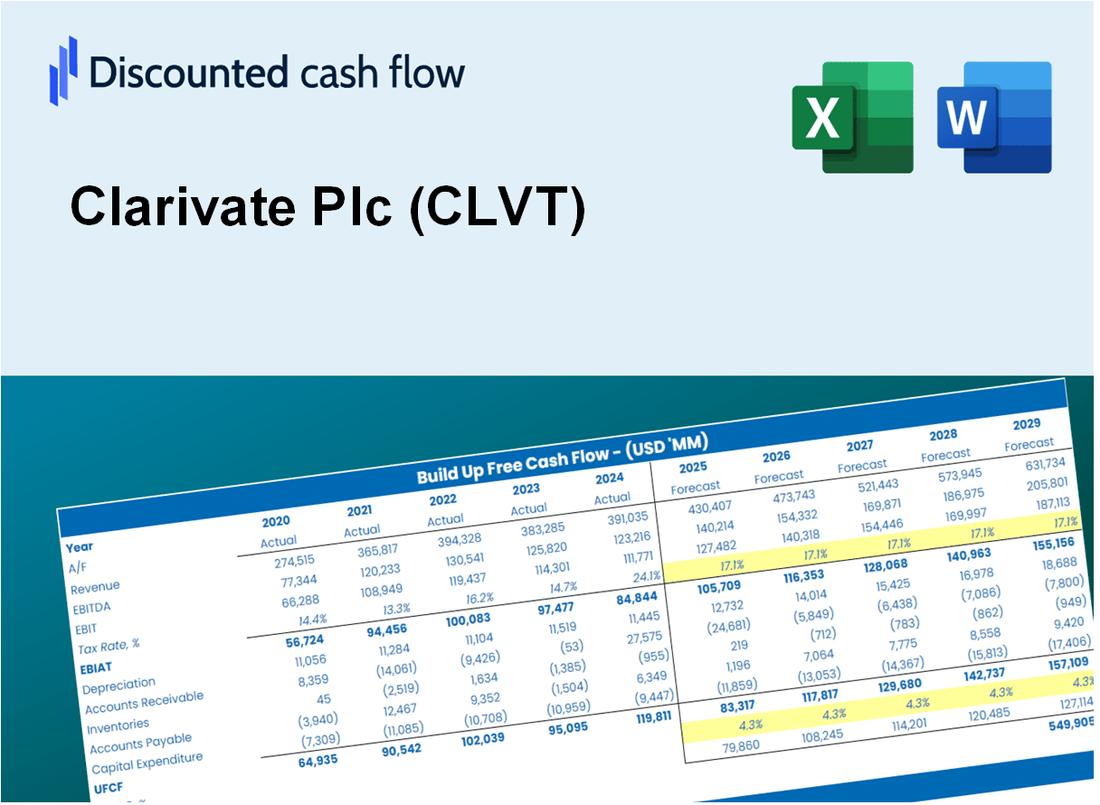
Si vous êtes un investisseur ou un analyste, cette calculatrice Clariv PLC (CLVT) DCF est votre ressource incontournable pour une évaluation précise. Avec des données réelles de Clarivate, vous pouvez ajuster les prévisions et observer immédiatement les effets.
Discounted Cash Flow (DCF) - (USD MM)
| Year | AY1 2020 |
AY2 2021 |
AY3 2022 |
AY4 2023 |
AY5 2024 |
FY1 2025 |
FY2 2026 |
FY3 2027 |
FY4 2028 |
FY5 2029 |
|---|---|---|---|---|---|---|---|---|---|---|
| Revenue | 1,876.9 | 1,876.9 | 2,659.8 | 2,628.8 | 2,556.7 | 2,798.3 | 3,062.8 | 3,352.3 | 3,669.1 | 4,015.9 |
| Revenue Growth, % | 0 | 0.000319677084 | 41.71 | -1.17 | -2.74 | 9.45 | 9.45 | 9.45 | 9.45 | 9.45 |
| EBITDA | 52.4 | 532.2 | -3,008.3 | -10.5 | 456.6 | -287.7 | -314.8 | -344.6 | -377.2 | -412.8 |
| EBITDA, % | 2.79 | 28.35 | -113.1 | -0.39942 | 17.86 | -10.28 | -10.28 | -10.28 | -10.28 | -10.28 |
| Depreciation | 303.2 | 537.8 | 710.5 | 708.3 | 727.0 | 710.2 | 777.3 | 850.8 | 931.2 | 1,019.2 |
| Depreciation, % | 16.15 | 28.65 | 26.71 | 26.94 | 28.44 | 25.38 | 25.38 | 25.38 | 25.38 | 25.38 |
| EBIT | -250.8 | -5.6 | -3,718.8 | -718.8 | -270.4 | -848.3 | -928.5 | -1,016.3 | -1,112.3 | -1,217.5 |
| EBIT, % | -13.36 | -0.30076 | -139.82 | -27.34 | -10.58 | -30.32 | -30.32 | -30.32 | -30.32 | -30.32 |
| Total Cash | 430.9 | 348.8 | 348.8 | 370.7 | 295.2 | 449.4 | 491.9 | 538.4 | 589.3 | 645.0 |
| Total Cash, percent | .0 | .0 | .0 | .0 | .0 | .0 | .0 | .0 | .0 | .0 |
| Account Receivables | 737.7 | 906.4 | 872.1 | 908.3 | 798.3 | 1,041.9 | 1,140.4 | 1,248.1 | 1,366.1 | 1,495.2 |
| Account Receivables, % | 39.31 | 48.29 | 32.79 | 34.55 | 31.22 | 37.23 | 37.23 | 37.23 | 37.23 | 37.23 |
| Inventories | 233.3 | 97.4 | 97.4 | .0 | .0 | 119.1 | 130.4 | 142.7 | 156.2 | 170.9 |
| Inventories, % | 12.43 | 5.19 | 3.66 | 0 | 0 | 4.26 | 4.26 | 4.26 | 4.26 | 4.26 |
| Accounts Payable | 82.0 | 129.2 | 101.4 | 144.1 | 124.5 | 142.3 | 155.7 | 170.4 | 186.5 | 204.2 |
| Accounts Payable, % | 4.37 | 6.88 | 3.81 | 5.48 | 4.87 | 5.08 | 5.08 | 5.08 | 5.08 | 5.08 |
| Capital Expenditure | -118.5 | -118.5 | -202.9 | -242.5 | -289.1 | -228.3 | -249.9 | -273.5 | -299.3 | -327.6 |
| Capital Expenditure, % | -6.32 | -6.31 | -7.63 | -9.22 | -11.31 | -8.16 | -8.16 | -8.16 | -8.16 | -8.16 |
| Tax Rate, % | -14.97 | -14.97 | -14.97 | -14.97 | -14.97 | -14.97 | -14.97 | -14.97 | -14.97 | -14.97 |
| EBITAT | -262.7 | -5.9 | -3,691.9 | -646.9 | -310.9 | -830.1 | -908.6 | -994.5 | -1,088.5 | -1,191.3 |
| Depreciation | ||||||||||
| Changes in Account Receivables | ||||||||||
| Changes in Inventories | ||||||||||
| Changes in Accounts Payable | ||||||||||
| Capital Expenditure | ||||||||||
| UFCF | -967.1 | 427.8 | -3,177.8 | -77.2 | 217.4 | -693.2 | -477.4 | -522.6 | -571.9 | -626.0 |
| WACC, % | 7.82 | 7.82 | 7.79 | 7.42 | 7.82 | 7.73 | 7.73 | 7.73 | 7.73 | 7.73 |
| PV UFCF | ||||||||||
| SUM PV UFCF | -2,328.5 | |||||||||
| Long Term Growth Rate, % | 2.00 | |||||||||
| Free cash flow (T + 1) | -639 | |||||||||
| Terminal Value | -11,134 | |||||||||
| Present Terminal Value | -7,672 | |||||||||
| Enterprise Value | -10,000 | |||||||||
| Net Debt | 4,297 | |||||||||
| Equity Value | -14,297 | |||||||||
| Diluted Shares Outstanding, MM | 694 | |||||||||
| Equity Value Per Share | -20.61 |
What You Will Receive
- Comprehensive Financial Model: Clarivate's actual data allows for accurate DCF valuation.
- Complete Forecast Flexibility: Modify revenue growth, profit margins, WACC, and other critical factors.
- Real-Time Calculations: Instant updates provide immediate feedback as you adjust inputs.
- Professional-Grade Template: A polished Excel file crafted for high-quality valuation analysis.
- Adaptable and Reusable: Designed for versatility, enabling frequent use for in-depth forecasts.
Key Features
- Comprehensive Data: Clarivate’s extensive historical financial records and pre-populated forecasts.
- Customizable Parameters: Adjust WACC, tax rates, revenue growth, and EBITDA margins to fit your analysis.
- Real-Time Insights: Monitor Clarivate’s intrinsic value updates instantly as you modify inputs.
- Intuitive Visualizations: Engaging dashboard graphics showcase valuation outcomes and essential metrics.
- Designed for Precision: A robust tool tailored for analysts, investors, and financial professionals.
How It Works
- Download the Template: Gain immediate access to the Excel-based CLVT DCF Calculator.
- Input Your Assumptions: Modify the yellow-highlighted cells for growth rates, WACC, margins, and other variables.
- Instant Calculations: The model automatically recalculates Clarivate’s intrinsic value.
- Test Scenarios: Experiment with various assumptions to assess potential valuation shifts.
- Analyze and Decide: Leverage the results to inform your investment or financial analysis.
Why Choose This Calculator for Clarivate Plc (CLVT)?
- Designed for Experts: A sophisticated tool utilized by analysts, CFOs, and industry consultants.
- Accurate Data: Clarivate’s historical and forecasted financials integrated for precision.
- Flexible Scenario Analysis: Effortlessly simulate various forecasts and assumptions.
- Comprehensive Outputs: Automatically computes intrinsic value, NPV, and essential metrics.
- User-Friendly: Step-by-step guidance to facilitate your calculations.
Who Should Use This Product?
- Finance Students: Master valuation techniques and apply them to real-world data for Clarivate Plc (CLVT).
- Academics: Integrate professional models into your research or teaching focused on Clarivate Plc (CLVT).
- Investors: Validate your investment strategies and evaluate valuation results for Clarivate Plc (CLVT).
- Analysts: Enhance your efficiency with a ready-to-use, customizable DCF model for Clarivate Plc (CLVT).
- Small Business Owners: Discover how large public companies like Clarivate Plc (CLVT) are evaluated in the market.
What the Template Contains
- Operating and Balance Sheet Data: Pre-filled Clarivate Plc (CLVT) historical data and forecasts, including revenue, EBITDA, EBIT, and capital expenditures.
- WACC Calculation: A dedicated sheet for Weighted Average Cost of Capital (WACC), including parameters like Beta, risk-free rate, and share price.
- DCF Valuation (Unlevered and Levered): Editable Discounted Cash Flow models showing intrinsic value with detailed calculations.
- Financial Statements: Pre-loaded financial statements (annual and quarterly) to support analysis.
- Key Ratios: Includes profitability, leverage, and efficiency ratios for Clarivate Plc (CLVT).
- Dashboard and Charts: Visual summary of valuation outputs and assumptions to analyze results easily.
Disclaimer
All information, articles, and product details provided on this website are for general informational and educational purposes only. We do not claim any ownership over, nor do we intend to infringe upon, any trademarks, copyrights, logos, brand names, or other intellectual property mentioned or depicted on this site. Such intellectual property remains the property of its respective owners, and any references here are made solely for identification or informational purposes, without implying any affiliation, endorsement, or partnership.
We make no representations or warranties, express or implied, regarding the accuracy, completeness, or suitability of any content or products presented. Nothing on this website should be construed as legal, tax, investment, financial, medical, or other professional advice. In addition, no part of this site—including articles or product references—constitutes a solicitation, recommendation, endorsement, advertisement, or offer to buy or sell any securities, franchises, or other financial instruments, particularly in jurisdictions where such activity would be unlawful.
All content is of a general nature and may not address the specific circumstances of any individual or entity. It is not a substitute for professional advice or services. Any actions you take based on the information provided here are strictly at your own risk. You accept full responsibility for any decisions or outcomes arising from your use of this website and agree to release us from any liability in connection with your use of, or reliance upon, the content or products found herein.