
|
Compass Pathways plc (CMPS) Valation DCF |
Entièrement Modifiable: Adapté À Vos Besoins Dans Excel Ou Sheets
Conception Professionnelle: Modèles Fiables Et Conformes Aux Normes Du Secteur
Pré-Construits Pour Une Utilisation Rapide Et Efficace
Compatible MAC/PC, entièrement débloqué
Aucune Expertise N'Est Requise; Facile À Suivre
COMPASS Pathways plc (CMPS) Bundle
Découvrez la vraie valeur de Compass Pathways plc avec notre calculatrice DCF de qualité professionnelle! Ajustez les hypothèses clés, explorez divers scénarios et évaluez comment les différents facteurs influencent la valorisation de Compass Pathways plc - le tout dans un seul modèle Excel.
What You Will Get
- Editable Forecast Inputs: Easily adjust key assumptions (growth %, margins, WACC) to explore various scenarios.
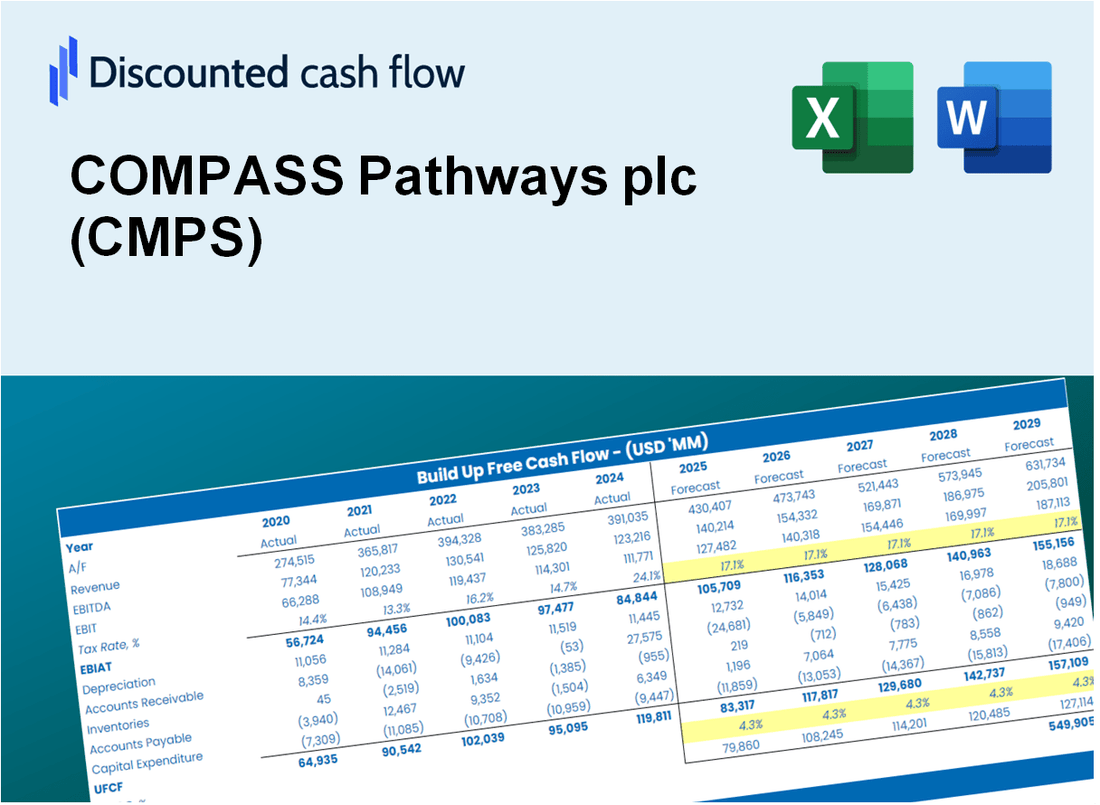
- Real-World Data: COMPASS Pathways plc’s financial data pre-loaded to enhance your analysis.
- Automatic DCF Outputs: The template computes Net Present Value (NPV) and intrinsic value automatically.
- Customizable and Professional: A refined Excel model tailored to your valuation requirements.
- Built for Analysts and Investors: Perfect for evaluating projections, confirming strategies, and optimizing efficiency.
Key Features
- Authentic COMPASS Financials: Gain access to precise pre-loaded historical data and future forecasts.
- Adjustable Forecast Parameters: Modify yellow-highlighted cells such as WACC, growth rates, and profit margins.
- Real-Time Calculations: Automatic updates to DCF, Net Present Value (NPV), and cash flow assessments.
- User-Friendly Dashboard: Clear charts and summaries to help visualize your valuation outcomes.
- Suitable for All Levels: A straightforward, intuitive layout designed for investors, CFOs, and consultants alike.
How It Works
- Download the Template: Gain immediate access to the Excel-based COMPASS Pathways DCF Calculator.
- Input Your Assumptions: Modify the yellow-highlighted cells for growth rates, WACC, margins, and other variables.
- Instant Calculations: The model automatically calculates the intrinsic value of COMPASS Pathways.
- Test Scenarios: Experiment with various assumptions to assess potential changes in valuation.
- Analyze and Decide: Utilize the findings to inform your investment or financial analysis.
Why Choose This Calculator for COMPASS Pathways plc (CMPS)?
- User-Friendly Interface: Perfect for both novices and seasoned professionals.
- Customizable Inputs: Adjust parameters effortlessly to tailor your analysis.
- Real-Time Feedback: Observe immediate updates to COMPASS Pathways' valuation as you modify inputs.
- Preloaded Data: Comes with COMPASS Pathways' actual financial metrics for swift evaluations.
- Relied Upon by Experts: Favored by investors and analysts for making well-informed choices.
Who Should Use This Product?
- Healthcare Professionals: Understand the valuation of innovative therapies and their market potential.
- Researchers: Integrate advanced financial models into studies related to mental health and treatment efficacy.
- Investors: Evaluate your investment strategies and analyze valuation scenarios for COMPASS Pathways plc (CMPS).
- Financial Analysts: Enhance your analysis with a customizable DCF model tailored for biotech companies.
- Entrepreneurs: Learn how public biotech firms like COMPASS Pathways plc (CMPS) are assessed in the market.
What the Template Contains
- Pre-Filled Data: Includes COMPASS Pathways plc’s historical financials and forecasts.
- Discounted Cash Flow Model: Editable DCF valuation model with automatic calculations.
- Weighted Average Cost of Capital (WACC): A dedicated sheet for calculating WACC based on custom inputs.
- Key Financial Ratios: Analyze COMPASS Pathways plc's profitability, efficiency, and leverage.
- Customizable Inputs: Edit revenue growth, margins, and tax rates with ease.
- Clear Dashboard: Charts and tables summarizing key valuation results.
Disclaimer
All information, articles, and product details provided on this website are for general informational and educational purposes only. We do not claim any ownership over, nor do we intend to infringe upon, any trademarks, copyrights, logos, brand names, or other intellectual property mentioned or depicted on this site. Such intellectual property remains the property of its respective owners, and any references here are made solely for identification or informational purposes, without implying any affiliation, endorsement, or partnership.
We make no representations or warranties, express or implied, regarding the accuracy, completeness, or suitability of any content or products presented. Nothing on this website should be construed as legal, tax, investment, financial, medical, or other professional advice. In addition, no part of this site—including articles or product references—constitutes a solicitation, recommendation, endorsement, advertisement, or offer to buy or sell any securities, franchises, or other financial instruments, particularly in jurisdictions where such activity would be unlawful.
All content is of a general nature and may not address the specific circumstances of any individual or entity. It is not a substitute for professional advice or services. Any actions you take based on the information provided here are strictly at your own risk. You accept full responsibility for any decisions or outcomes arising from your use of this website and agree to release us from any liability in connection with your use of, or reliance upon, the content or products found herein.