
|
CNX Resources Corporation (CNX) Évaluation DCF |
Entièrement Modifiable: Adapté À Vos Besoins Dans Excel Ou Sheets
Conception Professionnelle: Modèles Fiables Et Conformes Aux Normes Du Secteur
Pré-Construits Pour Une Utilisation Rapide Et Efficace
Compatible MAC/PC, entièrement débloqué
Aucune Expertise N'Est Requise; Facile À Suivre
CNX Resources Corporation (CNX) Bundle
Optimisez votre temps et améliorez la précision avec notre calculatrice DCF (CNX)! Complète avec des données authentiques CNX Resources Corporation et des hypothèses personnalisables, cet outil vous permet de prévoir, analyser et valoriser (CNX) comme un investisseur chevronné.
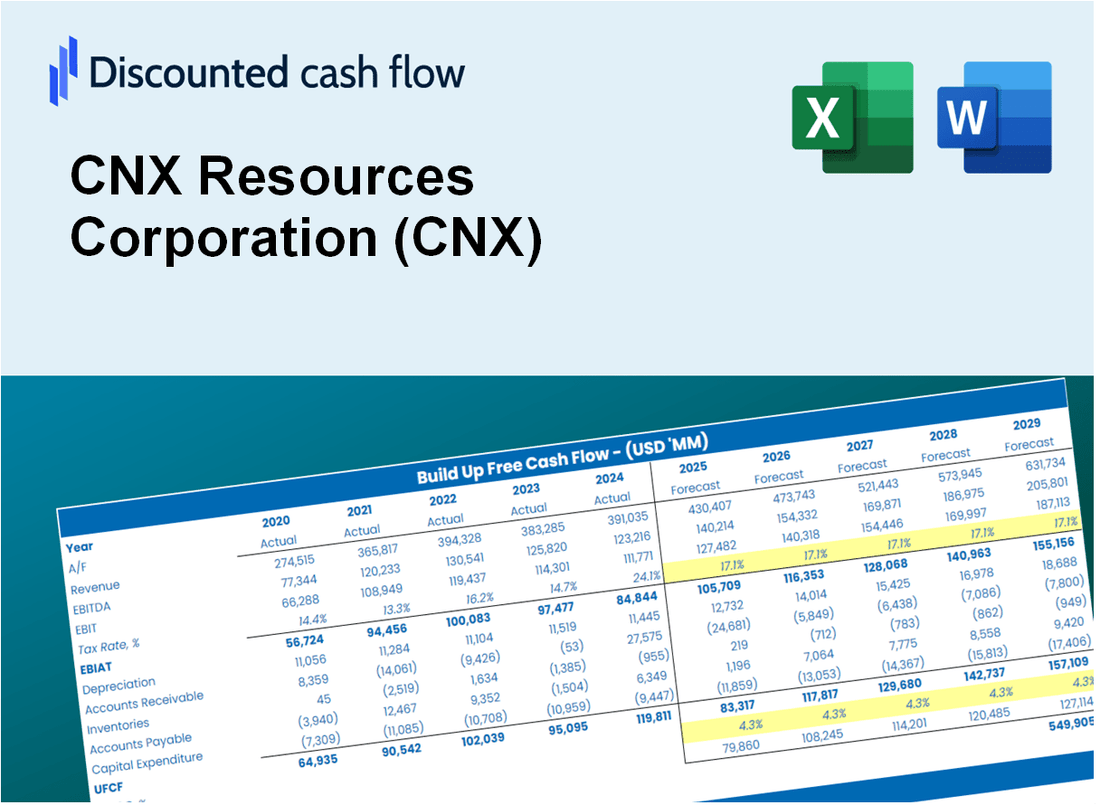
Discounted Cash Flow (DCF) - (USD MM)
| Year | AY1 2020 |
AY2 2021 |
AY3 2022 |
AY4 2023 |
AY5 2024 |
FY1 2025 |
FY2 2026 |
FY3 2027 |
FY4 2028 |
FY5 2029 |
|---|---|---|---|---|---|---|---|---|---|---|
| Revenue | 1,085.7 | 2,383.7 | 3,923.6 | 1,462.7 | 1,345.9 | 1,661.8 | 2,051.8 | 2,533.4 | 3,128.1 | 3,862.3 |
| Revenue Growth, % | 0 | 119.56 | 64.6 | -62.72 | -7.99 | 23.47 | 23.47 | 23.47 | 23.47 | 23.47 |
| EBITDA | 597.6 | 31.3 | 399.4 | 2,672.5 | 489.5 | 674.4 | 832.7 | 1,028.1 | 1,269.4 | 1,567.4 |
| EBITDA, % | 55.05 | 1.31 | 10.18 | 182.71 | 36.37 | 40.58 | 40.58 | 40.58 | 40.58 | 40.58 |
| Depreciation | 563.7 | 515.1 | 461.2 | 433.6 | 485.8 | 501.9 | 619.7 | 765.2 | 944.8 | 1,166.6 |
| Depreciation, % | 51.92 | 21.61 | 11.75 | 29.64 | 36.09 | 30.2 | 30.2 | 30.2 | 30.2 | 30.2 |
| EBIT | 34.0 | -483.9 | -61.8 | 2,238.9 | 3.7 | 271.0 | 334.6 | 413.1 | 510.1 | 629.8 |
| EBIT, % | 3.13 | -20.3 | -1.58 | 153.07 | 0.27849 | 16.31 | 16.31 | 16.31 | 16.31 | 16.31 |
| Total Cash | 15.6 | 3.6 | 21.3 | .4 | 17.2 | 11.4 | 14.1 | 17.4 | 21.5 | 26.6 |
| Total Cash, percent | .0 | .0 | .0 | .0 | .0 | .0 | .0 | .0 | .0 | .0 |
| Account Receivables | 150.3 | 339.1 | 354.6 | 134.0 | 197.4 | 202.5 | 250.0 | 308.7 | 381.2 | 470.7 |
| Account Receivables, % | 13.84 | 14.23 | 9.04 | 9.16 | 14.67 | 12.19 | 12.19 | 12.19 | 12.19 | 12.19 |
| Inventories | 9.7 | 6.1 | 27.2 | 19.8 | 14.6 | 14.2 | 17.6 | 21.7 | 26.8 | 33.1 |
| Inventories, % | 0.88949 | 0.25787 | 0.69212 | 1.36 | 1.08 | 0.85581 | 0.85581 | 0.85581 | 0.85581 | 0.85581 |
| Accounts Payable | 118.2 | 121.8 | 191.3 | 147.4 | 123.2 | 133.3 | 164.6 | 203.2 | 250.9 | 309.8 |
| Accounts Payable, % | 10.89 | 5.11 | 4.88 | 10.07 | 9.16 | 8.02 | 8.02 | 8.02 | 8.02 | 8.02 |
| Capital Expenditure | -487.3 | -465.9 | -565.8 | -679.4 | -540.3 | -549.9 | -678.9 | -838.3 | -1,035.0 | -1,278.0 |
| Capital Expenditure, % | -44.88 | -19.54 | -14.42 | -46.45 | -40.15 | -33.09 | -33.09 | -33.09 | -33.09 | -33.09 |
| Tax Rate, % | 24.82 | 24.82 | 24.82 | 24.82 | 24.82 | 24.82 | 24.82 | 24.82 | 24.82 | 24.82 |
| EBITAT | 27.3 | -379.1 | -41.5 | 1,733.1 | 2.8 | 205.0 | 253.1 | 312.5 | 385.8 | 476.4 |
| Depreciation | ||||||||||
| Changes in Account Receivables | ||||||||||
| Changes in Inventories | ||||||||||
| Changes in Accounts Payable | ||||||||||
| Capital Expenditure | ||||||||||
| UFCF | 61.9 | -511.6 | -112.9 | 1,671.2 | -134.0 | 162.3 | 174.3 | 215.2 | 265.7 | 328.1 |
| WACC, % | 6.38 | 6.35 | 6.13 | 6.33 | 6.29 | 6.3 | 6.3 | 6.3 | 6.3 | 6.3 |
| PV UFCF | ||||||||||
| SUM PV UFCF | 936.1 | |||||||||
| Long Term Growth Rate, % | 0.50 | |||||||||
| Free cash flow (T + 1) | 330 | |||||||||
| Terminal Value | 5,690 | |||||||||
| Present Terminal Value | 4,193 | |||||||||
| Enterprise Value | 5,130 | |||||||||
| Net Debt | 2,275 | |||||||||
| Equity Value | 2,854 | |||||||||
| Diluted Shares Outstanding, MM | 151 | |||||||||
| Equity Value Per Share | 18.87 |
What You Will Receive
- Pre-Filled Financial Model: CNX Resources Corporation’s actual data facilitates accurate DCF valuation.
- Comprehensive Forecast Control: Modify revenue growth, margins, WACC, and other essential drivers.
- Instantaneous Calculations: Automatic updates provide immediate results as adjustments are made.
- Investor-Ready Template: A polished Excel file crafted for high-quality valuation.
- Customizable and Reusable: Designed for adaptability, allowing repeated use for in-depth forecasts.
Key Features
- Comprehensive DCF Model: Features both unlevered and levered DCF valuation frameworks tailored for CNX Resources Corporation (CNX).
- WACC Tool: Ready-to-use Weighted Average Cost of Capital calculator with adjustable parameters for precise analysis.
- Customizable Forecast Inputs: Easily adjust growth projections, capital expenditures, and discount rates.
- Integrated Financial Ratios: Evaluate profitability, leverage, and efficiency metrics specifically for CNX Resources Corporation (CNX).
- Interactive Dashboard and Visualizations: Graphical representations of essential valuation indicators for straightforward evaluation.
How It Works
- 1. Access the Template: Download and open the Excel file containing CNX Resources Corporation's (CNX) preloaded data.
- 2. Modify Assumptions: Adjust key inputs such as growth rates, WACC, and capital expenditures to fit your analysis.
- 3. Analyze Results Instantly: The DCF model automatically calculates intrinsic value and NPV based on your inputs.
- 4. Explore Scenarios: Evaluate various forecasts to understand different valuation outcomes for CNX.
- 5. Present with Assurance: Deliver professional valuation insights to reinforce your investment decisions regarding CNX Resources Corporation (CNX).
Why Choose This Calculator for CNX Resources Corporation (CNX)?
- Designed for Industry Experts: A sophisticated tool tailored for analysts, financial officers, and consultants.
- Accurate Data: CNX's historical and projected financials are preloaded for precise analysis.
- Flexible Scenario Analysis: Effortlessly test various forecasts and assumptions.
- Comprehensive Outputs: Automatically computes intrinsic value, NPV, and essential metrics.
- User-Friendly Interface: Clear, step-by-step instructions facilitate a smooth experience.
Who Should Use This Product?
- Finance Students: Master valuation methods and apply them with real-world data for CNX Resources Corporation (CNX).
- Academics: Integrate industry-standard models into your curriculum or research focused on CNX.
- Investors: Validate your investment hypotheses and evaluate valuation scenarios for CNX Resources Corporation (CNX).
- Analysts: Enhance your analysis process with a ready-to-use, customizable DCF model tailored for CNX.
- Small Business Owners: Discover how large public entities like CNX Resources Corporation (CNX) are assessed and valued.
What the Template Contains
- Pre-Filled DCF Model: CNX Resources Corporation’s (CNX) financial data preloaded for immediate use.
- WACC Calculator: Detailed calculations for Weighted Average Cost of Capital specific to CNX.
- Financial Ratios: Assess CNX’s profitability, leverage, and efficiency metrics.
- Editable Inputs: Modify assumptions such as growth rates, margins, and CAPEX to suit your analysis.
- Financial Statements: Comprehensive annual and quarterly reports for in-depth evaluation.
- Interactive Dashboard: Visualize key valuation metrics and outcomes with ease.
Disclaimer
All information, articles, and product details provided on this website are for general informational and educational purposes only. We do not claim any ownership over, nor do we intend to infringe upon, any trademarks, copyrights, logos, brand names, or other intellectual property mentioned or depicted on this site. Such intellectual property remains the property of its respective owners, and any references here are made solely for identification or informational purposes, without implying any affiliation, endorsement, or partnership.
We make no representations or warranties, express or implied, regarding the accuracy, completeness, or suitability of any content or products presented. Nothing on this website should be construed as legal, tax, investment, financial, medical, or other professional advice. In addition, no part of this site—including articles or product references—constitutes a solicitation, recommendation, endorsement, advertisement, or offer to buy or sell any securities, franchises, or other financial instruments, particularly in jurisdictions where such activity would be unlawful.
All content is of a general nature and may not address the specific circumstances of any individual or entity. It is not a substitute for professional advice or services. Any actions you take based on the information provided here are strictly at your own risk. You accept full responsibility for any decisions or outcomes arising from your use of this website and agree to release us from any liability in connection with your use of, or reliance upon, the content or products found herein.