
|
PC Connection, Inc. (CNXN) Évaluation DCF |
Entièrement Modifiable: Adapté À Vos Besoins Dans Excel Ou Sheets
Conception Professionnelle: Modèles Fiables Et Conformes Aux Normes Du Secteur
Pré-Construits Pour Une Utilisation Rapide Et Efficace
Compatible MAC/PC, entièrement débloqué
Aucune Expertise N'Est Requise; Facile À Suivre
PC Connection, Inc. (CNXN) Bundle
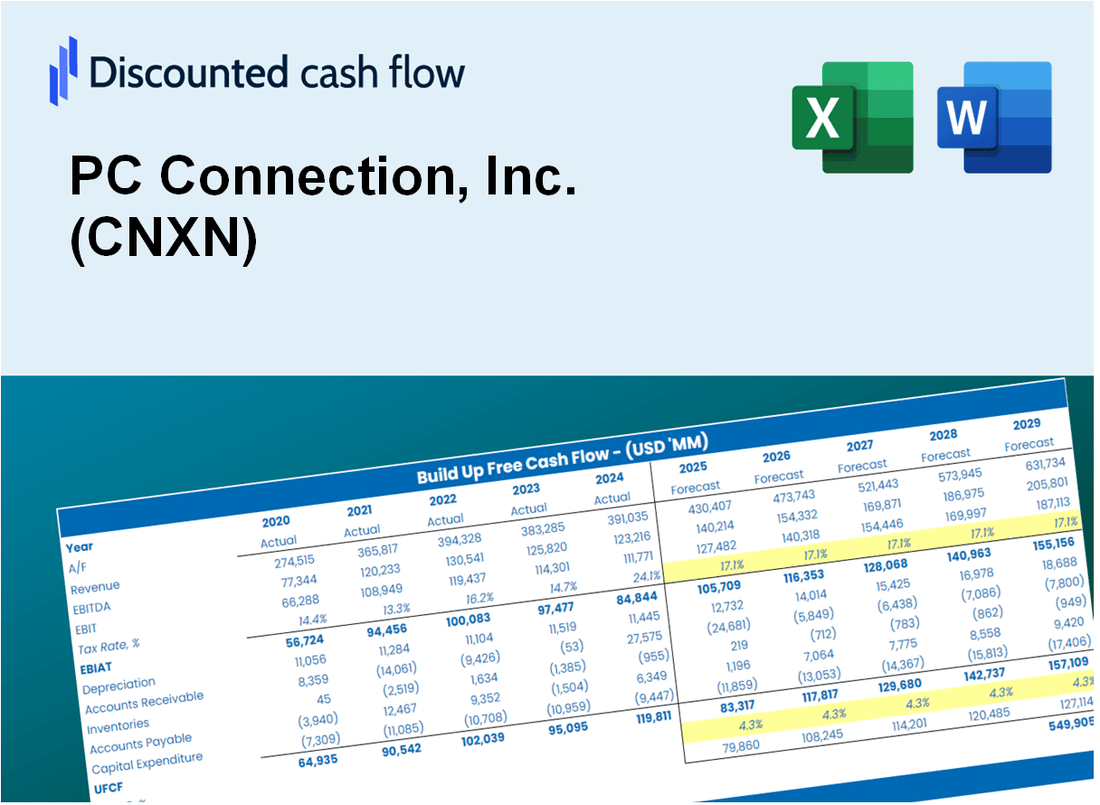
Découvrez la vraie valeur de PC Connection, Inc. (CNXN) avec notre calculatrice avancée DCF! Ajustez les hypothèses clés, explorez divers scénarios et évaluez comment les modifications affectent PC Connection, Inc. (CNXN) - le tout dans un modèle Excel pratique.
What You Will Receive
- Pre-Filled Financial Model: Leverage PC Connection, Inc.'s (CNXN) actual data for accurate DCF valuation.
- Complete Forecast Control: Modify revenue growth, profit margins, WACC, and other essential drivers.
- Instantaneous Calculations: Real-time updates provide immediate results as adjustments are made.
- Investor-Ready Template: A polished Excel file crafted for high-quality valuation presentations.
- Customizable and Reusable: Designed for adaptability, enabling repeated application for in-depth forecasts.
Key Features
- Customizable Financial Metrics: Adjust essential inputs such as sales growth, operating margin, and capital investments.
- Instant DCF Valuation: Quickly computes intrinsic value, net present value (NPV), and additional financial metrics.
- High Precision Valuation: Leverages PC Connection, Inc.'s (CNXN) actual financial data for credible valuation results.
- Effortless Scenario Testing: Easily evaluate various assumptions and analyze different outcomes.
- Efficiency Booster: Streamlines the valuation process, removing the need for complex model creation from the ground up.
How It Works
- Step 1: Download the Excel file for PC Connection, Inc. (CNXN).
- Step 2: Review the pre-filled financial data and forecasts for PC Connection, Inc. (CNXN).
- Step 3: Adjust key inputs such as revenue growth, WACC, and tax rates (highlighted cells).
- Step 4: Observe the DCF model update in real-time as you change your assumptions.
- Step 5: Analyze the results and utilize them for informed investment decisions regarding PC Connection, Inc. (CNXN).
Why Choose This Calculator for PC Connection, Inc. (CNXN)?
- All-in-One Solution: Combines DCF, WACC, and financial ratio analyses tailored for PC Connection, Inc. (CNXN).
- Flexible Variables: Modify the highlighted cells to explore different financial scenarios.
- In-Depth Analysis: Automatically computes the intrinsic value and Net Present Value for PC Connection, Inc. (CNXN).
- Data-Rich Environment: Features historical and projected data for precise analysis.
- Expert-Level Resource: Perfect for financial analysts, investors, and business advisors focusing on PC Connection, Inc. (CNXN).
Who Should Use This Product?
- Individual Investors: Gain insights to make informed decisions regarding investments in PC Connection, Inc. (CNXN).
- Financial Analysts: Enhance your analysis with comprehensive financial models tailored for PC Connection, Inc. (CNXN).
- Consultants: Provide clients with accurate and timely valuation assessments of PC Connection, Inc. (CNXN).
- Business Owners: Learn how companies like PC Connection, Inc. (CNXN) are valued to inform your business strategies.
- Finance Students: Explore real-world valuation methods using data from PC Connection, Inc. (CNXN).
What the Template Contains
- Preloaded CNXN Data: Historical and projected financial data, including revenue, EBIT, and capital expenditures.
- DCF and WACC Models: Professional-grade sheets for calculating intrinsic value and Weighted Average Cost of Capital.
- Editable Inputs: Yellow-highlighted cells for adjusting revenue growth, tax rates, and discount rates.
- Financial Statements: Comprehensive annual and quarterly financials for deeper analysis.
- Key Ratios: Profitability, leverage, and efficiency ratios to evaluate performance.
- Dashboard and Charts: Visual summaries of valuation outcomes and assumptions.
Disclaimer
All information, articles, and product details provided on this website are for general informational and educational purposes only. We do not claim any ownership over, nor do we intend to infringe upon, any trademarks, copyrights, logos, brand names, or other intellectual property mentioned or depicted on this site. Such intellectual property remains the property of its respective owners, and any references here are made solely for identification or informational purposes, without implying any affiliation, endorsement, or partnership.
We make no representations or warranties, express or implied, regarding the accuracy, completeness, or suitability of any content or products presented. Nothing on this website should be construed as legal, tax, investment, financial, medical, or other professional advice. In addition, no part of this site—including articles or product references—constitutes a solicitation, recommendation, endorsement, advertisement, or offer to buy or sell any securities, franchises, or other financial instruments, particularly in jurisdictions where such activity would be unlawful.
All content is of a general nature and may not address the specific circumstances of any individual or entity. It is not a substitute for professional advice or services. Any actions you take based on the information provided here are strictly at your own risk. You accept full responsibility for any decisions or outcomes arising from your use of this website and agree to release us from any liability in connection with your use of, or reliance upon, the content or products found herein.