
|
Cohu, Inc. (CoHU) Évaluation DCF |
Entièrement Modifiable: Adapté À Vos Besoins Dans Excel Ou Sheets
Conception Professionnelle: Modèles Fiables Et Conformes Aux Normes Du Secteur
Pré-Construits Pour Une Utilisation Rapide Et Efficace
Compatible MAC/PC, entièrement débloqué
Aucune Expertise N'Est Requise; Facile À Suivre
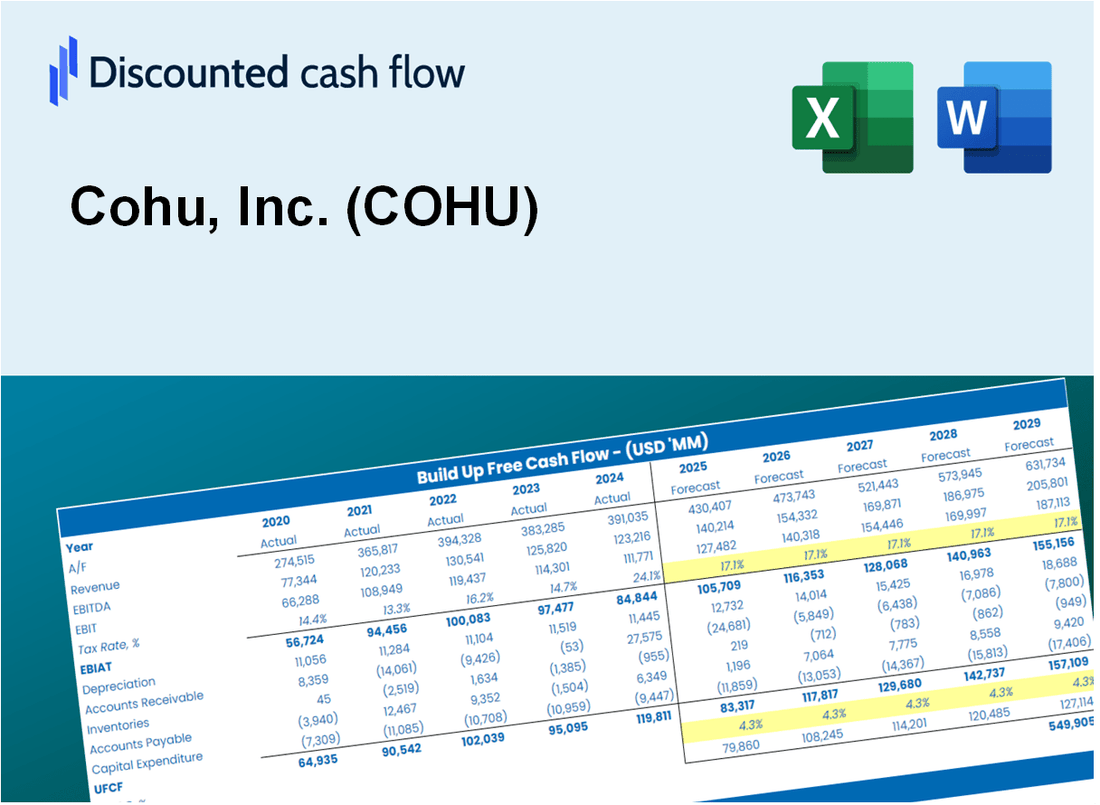
Cohu, Inc. (COHU) Bundle
Améliorez votre stratégie d'investissement avec la calculatrice DCF Cohu, Inc. (CoHU)! Accédez aux données financières réelles de Cohu, ajustez les projections et dépenses de croissance et observez comment ces changements affectent la valeur intrinsèque de Cohu en temps réel.
Discounted Cash Flow (DCF) - (USD MM)
| Year | AY1 2020 |
AY2 2021 |
AY3 2022 |
AY4 2023 |
AY5 2024 |
FY1 2025 |
FY2 2026 |
FY3 2027 |
FY4 2028 |
FY5 2029 |
|---|---|---|---|---|---|---|---|---|---|---|
| Revenue | 636.0 | 887.2 | 812.8 | 636.3 | 401.8 | 374.2 | 348.5 | 324.6 | 302.3 | 281.5 |
| Revenue Growth, % | 0 | 39.5 | -8.39 | -21.71 | -36.86 | -6.87 | -6.87 | -6.87 | -6.87 | -6.87 |
| EBITDA | 74.1 | 180.6 | 171.7 | 97.0 | -19.4 | 47.6 | 44.3 | 41.3 | 38.4 | 35.8 |
| EBITDA, % | 11.65 | 20.36 | 21.13 | 15.24 | -4.83 | 12.71 | 12.71 | 12.71 | 12.71 | 12.71 |
| Depreciation | 52.7 | 48.6 | 46.0 | 49.7 | 52.5 | 30.2 | 28.1 | 26.2 | 24.4 | 22.7 |
| Depreciation, % | 8.29 | 5.47 | 5.66 | 7.82 | 13.06 | 8.06 | 8.06 | 8.06 | 8.06 | 8.06 |
| EBIT | 21.4 | 132.1 | 125.7 | 47.2 | -71.9 | 17.4 | 16.2 | 15.1 | 14.1 | 13.1 |
| EBIT, % | 3.36 | 14.89 | 15.47 | 7.42 | -17.89 | 4.65 | 4.65 | 4.65 | 4.65 | 4.65 |
| Total Cash | 170.0 | 379.9 | 385.6 | 335.7 | 262.1 | 175.9 | 163.8 | 152.5 | 142.1 | 132.3 |
| Total Cash, percent | .0 | .0 | .0 | .0 | .0 | .0 | .0 | .0 | .0 | .0 |
| Account Receivables | 151.9 | 192.9 | 176.1 | 124.6 | 91.6 | 82.1 | 76.5 | 71.2 | 66.3 | 61.8 |
| Account Receivables, % | 23.89 | 21.74 | 21.67 | 19.59 | 22.8 | 21.94 | 21.94 | 21.94 | 21.94 | 21.94 |
| Inventories | 142.5 | 161.1 | 170.1 | 155.8 | 141.9 | 90.8 | 84.5 | 78.7 | 73.3 | 68.3 |
| Inventories, % | 22.41 | 18.15 | 20.93 | 24.48 | 35.31 | 24.26 | 24.26 | 24.26 | 24.26 | 24.26 |
| Accounts Payable | 67.9 | 85.2 | 51.8 | 33.6 | 30.6 | 29.6 | 27.6 | 25.7 | 23.9 | 22.3 |
| Accounts Payable, % | 10.68 | 9.61 | 6.37 | 5.28 | 7.6 | 7.91 | 7.91 | 7.91 | 7.91 | 7.91 |
| Capital Expenditure | -18.7 | -12.0 | -14.8 | -16.1 | -10.6 | -8.4 | -7.9 | -7.3 | -6.8 | -6.3 |
| Capital Expenditure, % | -2.93 | -1.35 | -1.82 | -2.52 | -2.65 | -2.25 | -2.25 | -2.25 | -2.25 | -2.25 |
| Tax Rate, % | -7.5 | -7.5 | -7.5 | -7.5 | -7.5 | -7.5 | -7.5 | -7.5 | -7.5 | -7.5 |
| EBITAT | 22.4 | 114.9 | 96.1 | 29.0 | -77.3 | 14.8 | 13.8 | 12.8 | 11.9 | 11.1 |
| Depreciation | ||||||||||
| Changes in Account Receivables | ||||||||||
| Changes in Inventories | ||||||||||
| Changes in Accounts Payable | ||||||||||
| Capital Expenditure | ||||||||||
| UFCF | -170.0 | 109.3 | 101.5 | 110.4 | 8.5 | 96.2 | 43.8 | 40.8 | 38.0 | 35.4 |
| WACC, % | 9.95 | 9.94 | 9.94 | 9.93 | 9.95 | 9.94 | 9.94 | 9.94 | 9.94 | 9.94 |
| PV UFCF | ||||||||||
| SUM PV UFCF | 202.5 | |||||||||
| Long Term Growth Rate, % | 3.50 | |||||||||
| Free cash flow (T + 1) | 37 | |||||||||
| Terminal Value | 569 | |||||||||
| Present Terminal Value | 354 | |||||||||
| Enterprise Value | 557 | |||||||||
| Net Debt | -188 | |||||||||
| Equity Value | 744 | |||||||||
| Diluted Shares Outstanding, MM | 47 | |||||||||
| Equity Value Per Share | 15.87 |
What You Will Get
- Real COHU Financials: Access to historical and projected data for precise valuation.
- Adjustable Inputs: Customize WACC, tax rates, revenue growth, and capital expenditures.
- Automatic Calculations: Dynamic calculations of intrinsic value and NPV.
- Scenario Analysis: Evaluate various scenarios to assess Cohu’s future performance.
- Clear and Intuitive Design: Designed for professionals while remaining user-friendly for newcomers.
Key Features
- Comprehensive DCF Calculator: Offers detailed unlevered and levered DCF valuation models tailored for Cohu, Inc. (COHU).
- WACC Calculator: Features a pre-built Weighted Average Cost of Capital sheet with adjustable inputs specific to Cohu, Inc. (COHU).
- Customizable Forecast Assumptions: Easily adjust growth rates, capital expenditures, and discount rates for accurate projections.
- Integrated Financial Ratios: Evaluate profitability, leverage, and efficiency ratios relevant to Cohu, Inc. (COHU).
- Interactive Dashboard and Charts: Visual representations summarize essential valuation metrics for straightforward analysis.
How It Works
- Step 1: Download the Excel file for Cohu, Inc. (COHU).
- Step 2: Review Cohu’s pre-filled financial data and projections.
- Step 3: Adjust key inputs such as revenue growth, WACC, and tax rates (highlighted cells).
- Step 4: Observe the DCF model refresh in real-time as you modify your assumptions.
- Step 5: Evaluate the outputs and leverage the results for your investment strategies.
Why Choose Cohu, Inc. (COHU) Calculator?
- Save Time: Ready-to-use model eliminates the hassle of starting from scratch.
- Enhance Accuracy: Dependable financial data and formulas minimize valuation errors.
- Completely Customizable: Adjust the model to align with your unique assumptions and forecasts.
- User-Friendly: Intuitive charts and outputs simplify result analysis.
- Endorsed by Professionals: Crafted for experts who prioritize accuracy and functionality.
Who Should Use This Product?
- Individual Investors: Gain insights for making informed decisions regarding Cohu, Inc. (COHU) stock transactions.
- Financial Analysts: Enhance valuation efforts with accessible financial models tailored for Cohu, Inc. (COHU).
- Consultants: Provide clients with accurate and timely valuation insights related to Cohu, Inc. (COHU).
- Business Owners: Learn about the valuation of companies like Cohu, Inc. (COHU) to inform your business strategy.
- Finance Students: Acquire practical valuation skills using real data and scenarios from Cohu, Inc. (COHU).
What the Template Contains
- Preloaded COHU Data: Historical and projected financial data, including revenue, EBIT, and capital expenditures.
- DCF and WACC Models: Professional-grade sheets for calculating intrinsic value and Weighted Average Cost of Capital.
- Editable Inputs: Yellow-highlighted cells for adjusting revenue growth, tax rates, and discount rates.
- Financial Statements: Comprehensive annual and quarterly financials for deeper analysis.
- Key Ratios: Profitability, leverage, and efficiency ratios to evaluate performance.
- Dashboard and Charts: Visual summaries of valuation outcomes and assumptions.
Disclaimer
All information, articles, and product details provided on this website are for general informational and educational purposes only. We do not claim any ownership over, nor do we intend to infringe upon, any trademarks, copyrights, logos, brand names, or other intellectual property mentioned or depicted on this site. Such intellectual property remains the property of its respective owners, and any references here are made solely for identification or informational purposes, without implying any affiliation, endorsement, or partnership.
We make no representations or warranties, express or implied, regarding the accuracy, completeness, or suitability of any content or products presented. Nothing on this website should be construed as legal, tax, investment, financial, medical, or other professional advice. In addition, no part of this site—including articles or product references—constitutes a solicitation, recommendation, endorsement, advertisement, or offer to buy or sell any securities, franchises, or other financial instruments, particularly in jurisdictions where such activity would be unlawful.
All content is of a general nature and may not address the specific circumstances of any individual or entity. It is not a substitute for professional advice or services. Any actions you take based on the information provided here are strictly at your own risk. You accept full responsibility for any decisions or outcomes arising from your use of this website and agree to release us from any liability in connection with your use of, or reliance upon, the content or products found herein.