
|
Cosmos Holdings Inc. (COSM) Évaluation DCF |
Entièrement Modifiable: Adapté À Vos Besoins Dans Excel Ou Sheets
Conception Professionnelle: Modèles Fiables Et Conformes Aux Normes Du Secteur
Pré-Construits Pour Une Utilisation Rapide Et Efficace
Compatible MAC/PC, entièrement débloqué
Aucune Expertise N'Est Requise; Facile À Suivre
Cosmos Holdings Inc. (COSM) Bundle
Rationalisez votre analyse et améliorez la précision avec notre calculatrice (COSM) DCF! Propulsé par des données réelles de Cosmos Holdings Inc. et des hypothèses personnalisables, cet outil vous permet de prévoir, analyser et valoriser (COSM) tout comme un investisseur chevronné.
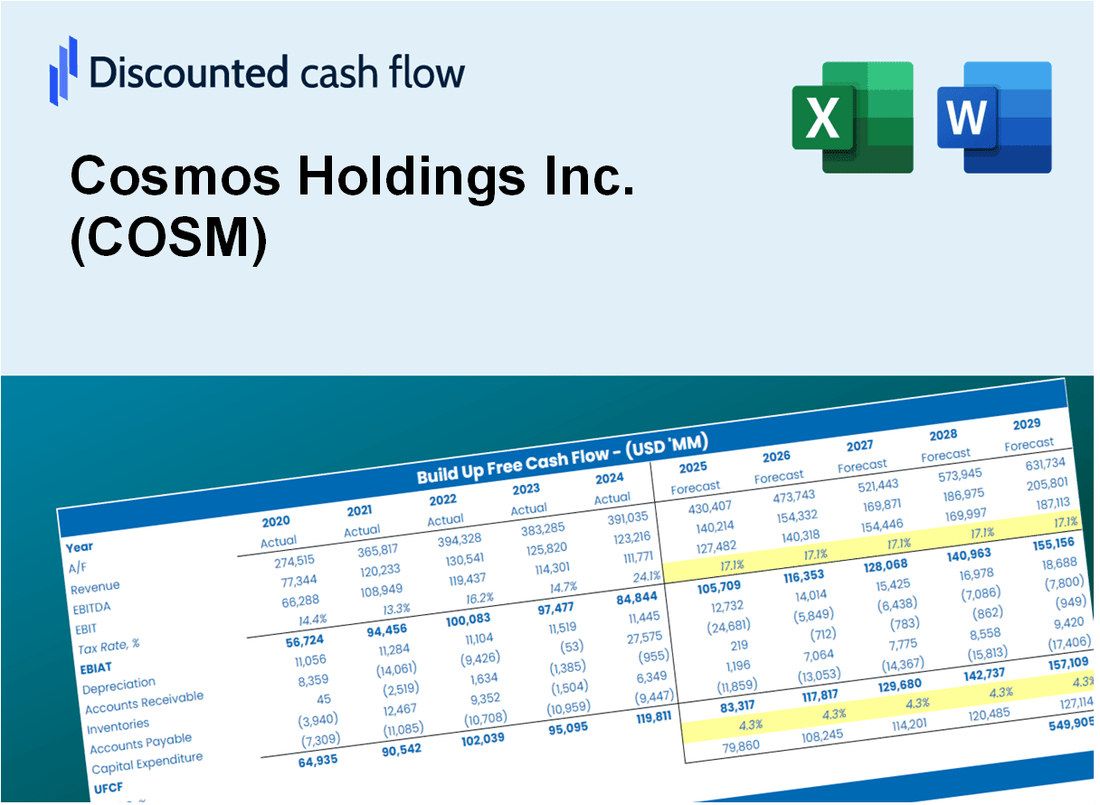
Discounted Cash Flow (DCF) - (USD MM)
| Year | AY1 2020 |
AY2 2021 |
AY3 2022 |
AY4 2023 |
AY5 2024 |
FY1 2025 |
FY2 2026 |
FY3 2027 |
FY4 2028 |
FY5 2029 |
|---|---|---|---|---|---|---|---|---|---|---|
| Revenue | 55.4 | 56.2 | 50.3 | 53.4 | 54.4 | 54.3 | 54.2 | 54.0 | 53.9 | 53.8 |
| Revenue Growth, % | 0 | 1.5 | -10.48 | 6.02 | 1.97 | -0.24743 | -0.24743 | -0.24743 | -0.24743 | -0.24743 |
| EBITDA | 4.4 | -3.8 | -8.9 | -17.1 | -13.9 | -8.0 | -8.0 | -8.0 | -8.0 | -8.0 |
| EBITDA, % | 7.93 | -6.79 | -17.68 | -31.96 | -25.58 | -14.82 | -14.82 | -14.82 | -14.82 | -14.82 |
| Depreciation | .4 | .4 | .2 | .6 | 1.2 | .6 | .6 | .6 | .6 | .6 |
| Depreciation, % | 0.7176 | 0.7996 | 0.37517 | 1.15 | 2.3 | 1.07 | 1.07 | 1.07 | 1.07 | 1.07 |
| EBIT | 4.0 | -4.3 | -9.1 | -17.7 | -15.2 | -8.6 | -8.6 | -8.6 | -8.6 | -8.5 |
| EBIT, % | 7.21 | -7.59 | -18.05 | -33.12 | -27.87 | -15.88 | -15.88 | -15.88 | -15.88 | -15.88 |
| Total Cash | .9 | .3 | 20.8 | 3.9 | .3 | 5.6 | 5.5 | 5.5 | 5.5 | 5.5 |
| Total Cash, percent | .0 | .0 | .0 | .0 | .0 | .0 | .0 | .0 | .0 | .0 |
| Account Receivables | 26.9 | 30.1 | 22.8 | 21.7 | 15.9 | 23.6 | 23.5 | 23.5 | 23.4 | 23.4 |
| Account Receivables, % | 48.57 | 53.59 | 45.21 | 40.68 | 29.18 | 43.44 | 43.44 | 43.44 | 43.44 | 43.44 |
| Inventories | .0 | 3.1 | 3.5 | 4.8 | 4.4 | 3.2 | 3.2 | 3.2 | 3.2 | 3.2 |
| Inventories, % | 0 | 5.6 | 6.86 | 8.97 | 8 | 5.89 | 5.89 | 5.89 | 5.89 | 5.89 |
| Accounts Payable | 12.0 | 12.3 | 10.3 | 11.9 | 11.2 | 11.6 | 11.6 | 11.5 | 11.5 | 11.5 |
| Accounts Payable, % | 21.61 | 21.92 | 20.38 | 22.32 | 20.5 | 21.35 | 21.35 | 21.35 | 21.35 | 21.35 |
| Capital Expenditure | -.1 | -.9 | -.4 | -9.2 | -.4 | -2.2 | -2.2 | -2.2 | -2.2 | -2.2 |
| Capital Expenditure, % | -0.21251 | -1.58 | -0.76086 | -17.18 | -0.76815 | -4.1 | -4.1 | -4.1 | -4.1 | -4.1 |
| Tax Rate, % | 0 | 0 | 0 | 0 | 0 | 0 | 0 | 0 | 0 | 0 |
| EBITAT | 2.7 | -4.3 | -9.6 | -17.7 | -15.2 | -8.1 | -8.1 | -8.0 | -8.0 | -8.0 |
| Depreciation | ||||||||||
| Changes in Account Receivables | ||||||||||
| Changes in Inventories | ||||||||||
| Changes in Accounts Payable | ||||||||||
| Capital Expenditure | ||||||||||
| UFCF | -11.9 | -10.8 | -4.8 | -24.9 | -8.8 | -15.8 | -9.7 | -9.6 | -9.6 | -9.6 |
| WACC, % | 15.86 | 17.1 | 17.1 | 17.1 | 17.1 | 16.85 | 16.85 | 16.85 | 16.85 | 16.85 |
| PV UFCF | ||||||||||
| SUM PV UFCF | -36.2 | |||||||||
| Long Term Growth Rate, % | 2.00 | |||||||||
| Free cash flow (T + 1) | -10 | |||||||||
| Terminal Value | -66 | |||||||||
| Present Terminal Value | -30 | |||||||||
| Enterprise Value | -66 | |||||||||
| Net Debt | 12 | |||||||||
| Equity Value | -78 | |||||||||
| Diluted Shares Outstanding, MM | 19 | |||||||||
| Equity Value Per Share | -4.07 |
What You Will Get
- Real COSM Financial Data: Pre-filled with Cosmos Holdings Inc.'s historical and projected data for accurate analysis.
- Fully Editable Template: Easily modify key inputs such as revenue growth, WACC, and EBITDA %.
- Automatic Calculations: Watch COSM's intrinsic value update in real-time based on your adjustments.
- Professional Valuation Tool: Tailored for investors, analysts, and consultants looking for precise DCF results.
- User-Friendly Design: Intuitive structure and straightforward instructions suitable for all experience levels.
Key Features
- Customizable Financial Metrics: Adjust essential inputs such as sales growth, gross margin %, and operating expenses.
- Instant DCF Valuation: Quickly computes intrinsic value, NPV, and other financial metrics.
- High-Precision Accuracy: Leverages Cosmos Holdings Inc.'s (COSM) actual financial data for dependable valuation results.
- Effortless Scenario Analysis: Explore various assumptions and evaluate results with ease.
- Efficiency Booster: Avoid the hassle of creating intricate valuation models from the ground up.
How It Works
- Step 1: Download the Excel file.
- Step 2: Review Cosmos Holdings Inc.'s (COSM) pre-filled financial data and forecasts.
- Step 3: Modify critical inputs such as revenue growth, WACC, and tax rates (highlighted cells).
- Step 4: Observe the DCF model update instantly as you adjust your assumptions.
- Step 5: Analyze the outputs and leverage the results for investment decisions.
Why Choose This Calculator for Cosmos Holdings Inc. (COSM)?
- User-Friendly Interface: Perfectly suited for both novices and seasoned professionals.
- Customizable Inputs: Effortlessly adjust variables to align with your financial analysis.
- Real-Time Feedback: Observe immediate changes in Cosmos Holdings’ valuation as you modify inputs.
- Preloaded Data: Comes with Cosmos Holdings’ actual financial figures for swift assessments.
- Relied Upon by Experts: Favored by investors and analysts for making well-informed choices.
Who Should Use This Product?
- Individual Investors: Make informed decisions about buying or selling Cosmos Holdings Inc. (COSM) stock.
- Financial Analysts: Enhance valuation processes with comprehensive financial models tailored for Cosmos Holdings Inc. (COSM).
- Consultants: Provide clients with accurate and timely valuation insights related to Cosmos Holdings Inc. (COSM).
- Business Owners: Gain insights into how companies like Cosmos Holdings Inc. (COSM) are valued to inform your own business strategies.
- Finance Students: Master valuation techniques using real-world data and examples from Cosmos Holdings Inc. (COSM).
What the Template Contains
- Historical Data: Includes Cosmos Holdings Inc.'s (COSM) past financials and baseline forecasts.
- DCF and Levered DCF Models: Detailed templates to calculate Cosmos Holdings Inc.'s (COSM) intrinsic value.
- WACC Sheet: Pre-built calculations for Weighted Average Cost of Capital.
- Editable Inputs: Modify key drivers like growth rates, EBITDA %, and CAPEX assumptions.
- Quarterly and Annual Statements: A complete breakdown of Cosmos Holdings Inc.'s (COSM) financials.
- Interactive Dashboard: Visualize valuation results and projections dynamically.
Disclaimer
All information, articles, and product details provided on this website are for general informational and educational purposes only. We do not claim any ownership over, nor do we intend to infringe upon, any trademarks, copyrights, logos, brand names, or other intellectual property mentioned or depicted on this site. Such intellectual property remains the property of its respective owners, and any references here are made solely for identification or informational purposes, without implying any affiliation, endorsement, or partnership.
We make no representations or warranties, express or implied, regarding the accuracy, completeness, or suitability of any content or products presented. Nothing on this website should be construed as legal, tax, investment, financial, medical, or other professional advice. In addition, no part of this site—including articles or product references—constitutes a solicitation, recommendation, endorsement, advertisement, or offer to buy or sell any securities, franchises, or other financial instruments, particularly in jurisdictions where such activity would be unlawful.
All content is of a general nature and may not address the specific circumstances of any individual or entity. It is not a substitute for professional advice or services. Any actions you take based on the information provided here are strictly at your own risk. You accept full responsibility for any decisions or outcomes arising from your use of this website and agree to release us from any liability in connection with your use of, or reliance upon, the content or products found herein.