
|
Chesapeake Utilities Corporation (CPK) Évaluation DCF |
Entièrement Modifiable: Adapté À Vos Besoins Dans Excel Ou Sheets
Conception Professionnelle: Modèles Fiables Et Conformes Aux Normes Du Secteur
Pré-Construits Pour Une Utilisation Rapide Et Efficace
Compatible MAC/PC, entièrement débloqué
Aucune Expertise N'Est Requise; Facile À Suivre
Chesapeake Utilities Corporation (CPK) Bundle
Évaluez les perspectives financières de Chesapeake Utilities Corporation (CPK) comme un expert! Cette calculatrice DCF (CPK) est livrée avec des données financières pré-remplies et offre une pleine flexibilité pour modifier la croissance des revenus, le WACC, les marges et d'autres hypothèses essentielles pour s'aligner sur vos projections.
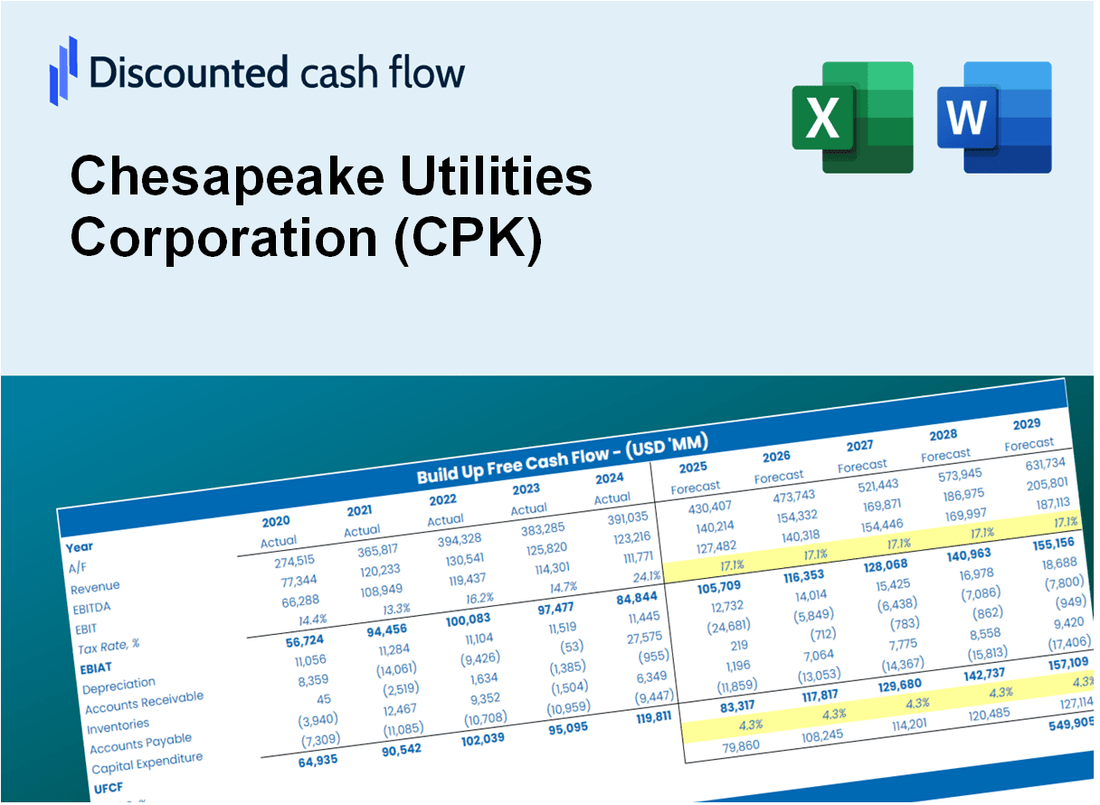
Discounted Cash Flow (DCF) - (USD MM)
| Year | AY1 2020 |
AY2 2021 |
AY3 2022 |
AY4 2023 |
AY5 2024 |
FY1 2025 |
FY2 2026 |
FY3 2027 |
FY4 2028 |
FY5 2029 |
|---|---|---|---|---|---|---|---|---|---|---|
| Revenue | 488.2 | 570.0 | 680.7 | 670.6 | 787.2 | 889.7 | 1,005.5 | 1,136.5 | 1,284.4 | 1,451.7 |
| Revenue Growth, % | 0 | 16.75 | 19.43 | -1.48 | 17.39 | 13.02 | 13.02 | 13.02 | 13.02 | 13.02 |
| EBITDA | 183.7 | 205.7 | 228.0 | 229.6 | 311.7 | 322.1 | 364.1 | 411.5 | 465.1 | 525.6 |
| EBITDA, % | 37.62 | 36.09 | 33.49 | 34.24 | 39.6 | 36.21 | 36.21 | 36.21 | 36.21 | 36.21 |
| Depreciation | 67.7 | 72.9 | 80.0 | 77.4 | 81.5 | 107.3 | 121.3 | 137.1 | 154.9 | 175.1 |
| Depreciation, % | 13.87 | 12.79 | 11.75 | 11.54 | 10.35 | 12.06 | 12.06 | 12.06 | 12.06 | 12.06 |
| EBIT | 115.9 | 132.8 | 148.0 | 152.2 | 230.2 | 214.8 | 242.8 | 274.4 | 310.2 | 350.5 |
| EBIT, % | 23.75 | 23.31 | 21.74 | 22.7 | 29.24 | 24.15 | 24.15 | 24.15 | 24.15 | 24.15 |
| Total Cash | 3.5 | 5.0 | 6.2 | 4.9 | 7.9 | 7.5 | 8.5 | 9.6 | 10.9 | 12.3 |
| Total Cash, percent | .0 | .0 | .0 | .0 | .0 | .0 | .0 | .0 | .0 | .0 |
| Account Receivables | 91.3 | 98.5 | 94.6 | 108.2 | 121.3 | 144.9 | 163.7 | 185.1 | 209.2 | 236.4 |
| Account Receivables, % | 18.7 | 17.27 | 13.9 | 16.14 | 15.41 | 16.28 | 16.28 | 16.28 | 16.28 | 16.28 |
| Inventories | 11.4 | 21.0 | 26.3 | 29.2 | 26.9 | 31.4 | 35.5 | 40.1 | 45.4 | 51.3 |
| Inventories, % | 2.34 | 3.68 | 3.86 | 4.36 | 3.42 | 3.53 | 3.53 | 3.53 | 3.53 | 3.53 |
| Accounts Payable | 60.3 | 52.6 | 61.5 | 77.5 | 78.3 | 92.7 | 104.8 | 118.4 | 133.9 | 151.3 |
| Accounts Payable, % | 12.34 | 9.23 | 9.03 | 11.55 | 9.95 | 10.42 | 10.42 | 10.42 | 10.42 | 10.42 |
| Capital Expenditure | -165.5 | -186.9 | -128.3 | -188.6 | -355.3 | -282.6 | -319.4 | -360.9 | -407.9 | -461.1 |
| Capital Expenditure, % | -33.9 | -32.8 | -18.84 | -28.13 | -45.13 | -31.76 | -31.76 | -31.76 | -31.76 | -31.76 |
| Tax Rate, % | 26.7 | 26.7 | 26.7 | 26.7 | 26.7 | 26.7 | 26.7 | 26.7 | 26.7 | 26.7 |
| EBITAT | 88.0 | 98.4 | 107.5 | 115.1 | 168.7 | 159.6 | 180.4 | 203.9 | 230.5 | 260.5 |
| Depreciation | ||||||||||
| Changes in Account Receivables | ||||||||||
| Changes in Inventories | ||||||||||
| Changes in Accounts Payable | ||||||||||
| Capital Expenditure | ||||||||||
| UFCF | -52.3 | -40.0 | 66.7 | 3.3 | -115.0 | -29.3 | -28.5 | -32.2 | -36.4 | -41.2 |
| WACC, % | 6.21 | 6.19 | 6.16 | 6.21 | 6.17 | 6.19 | 6.19 | 6.19 | 6.19 | 6.19 |
| PV UFCF | ||||||||||
| SUM PV UFCF | -139.0 | |||||||||
| Long Term Growth Rate, % | 3.00 | |||||||||
| Free cash flow (T + 1) | -42 | |||||||||
| Terminal Value | -1,330 | |||||||||
| Present Terminal Value | -985 | |||||||||
| Enterprise Value | -1,124 | |||||||||
| Net Debt | 1,485 | |||||||||
| Equity Value | -2,609 | |||||||||
| Diluted Shares Outstanding, MM | 23 | |||||||||
| Equity Value Per Share | -115.79 |
What You Will Get
- Real CPK Financial Data: Pre-filled with Chesapeake Utilities Corporation’s historical and projected data for precise analysis.
- Fully Editable Template: Modify key inputs like revenue growth, WACC, and EBITDA % with ease.
- Automatic Calculations: See CPK’s intrinsic value update instantly based on your changes.
- Professional Valuation Tool: Designed for investors, analysts, and consultants seeking accurate DCF results.
- User-Friendly Design: Simple structure and clear instructions for all experience levels.
Key Features
- Pre-Loaded Data: Chesapeake Utilities Corporation’s historical financial statements and pre-filled forecasts.
- Fully Adjustable Inputs: Customize WACC, tax rates, revenue growth, and EBITDA margins.
- Instant Results: View Chesapeake Utilities Corporation’s intrinsic value recalculating in real time.
- Clear Visual Outputs: Dashboard charts present valuation results and essential metrics.
- Built for Accuracy: A professional tool designed for analysts, investors, and finance professionals.
How It Works
- Download: Obtain the pre-formatted Excel file featuring Chesapeake Utilities Corporation’s (CPK) financial data.
- Customize: Tailor forecasts such as revenue growth, EBITDA %, and WACC to fit your analysis.
- Update Automatically: Watch as intrinsic value and NPV calculations refresh in real-time.
- Test Scenarios: Generate various projections and instantly compare the results.
- Make Decisions: Leverage the valuation findings to inform your investment strategy.
Why Choose This Calculator for Chesapeake Utilities Corporation (CPK)?
- Reliable Data: Access to real Chesapeake Utilities financials ensures trustworthy valuation outcomes.
- Flexible Options: Tailor essential parameters such as growth rates, WACC, and tax rates to fit your forecasts.
- Efficiency Boost: Built-in calculations save you time and prevent the hassle of starting from scratch.
- Expert-Level Tool: Crafted for investors, analysts, and consultants focusing on Chesapeake Utilities.
- Easy to Use: User-friendly design and clear instructions allow all users to navigate with ease.
Who Should Use This Product?
- Individual Investors: Make informed decisions about buying or selling Chesapeake Utilities Corporation (CPK) stock.
- Financial Analysts: Streamline valuation processes with ready-to-use financial models for Chesapeake Utilities Corporation (CPK).
- Consultants: Deliver professional valuation insights on Chesapeake Utilities Corporation (CPK) to clients quickly and accurately.
- Business Owners: Understand how utility companies like Chesapeake Utilities Corporation (CPK) are valued to guide your own strategy.
- Finance Students: Learn valuation techniques using real-world data and scenarios related to Chesapeake Utilities Corporation (CPK).
What the Template Contains
- Historical Data: Includes Chesapeake Utilities Corporation’s past financials and baseline forecasts.
- DCF and Levered DCF Models: Detailed templates to calculate Chesapeake Utilities Corporation’s intrinsic value.
- WACC Sheet: Pre-built calculations for Weighted Average Cost of Capital.
- Editable Inputs: Modify key drivers like growth rates, EBITDA %, and CAPEX assumptions.
- Quarterly and Annual Statements: A complete breakdown of Chesapeake Utilities Corporation’s financials.
- Interactive Dashboard: Visualize valuation results and projections dynamically.
Disclaimer
All information, articles, and product details provided on this website are for general informational and educational purposes only. We do not claim any ownership over, nor do we intend to infringe upon, any trademarks, copyrights, logos, brand names, or other intellectual property mentioned or depicted on this site. Such intellectual property remains the property of its respective owners, and any references here are made solely for identification or informational purposes, without implying any affiliation, endorsement, or partnership.
We make no representations or warranties, express or implied, regarding the accuracy, completeness, or suitability of any content or products presented. Nothing on this website should be construed as legal, tax, investment, financial, medical, or other professional advice. In addition, no part of this site—including articles or product references—constitutes a solicitation, recommendation, endorsement, advertisement, or offer to buy or sell any securities, franchises, or other financial instruments, particularly in jurisdictions where such activity would be unlawful.
All content is of a general nature and may not address the specific circumstances of any individual or entity. It is not a substitute for professional advice or services. Any actions you take based on the information provided here are strictly at your own risk. You accept full responsibility for any decisions or outcomes arising from your use of this website and agree to release us from any liability in connection with your use of, or reliance upon, the content or products found herein.