
|
Credo Technology Group Holding Ltd (CRDO) Valation DCF |
Entièrement Modifiable: Adapté À Vos Besoins Dans Excel Ou Sheets
Conception Professionnelle: Modèles Fiables Et Conformes Aux Normes Du Secteur
Pré-Construits Pour Une Utilisation Rapide Et Efficace
Compatible MAC/PC, entièrement débloqué
Aucune Expertise N'Est Requise; Facile À Suivre
Credo Technology Group Holding Ltd (CRDO) Bundle
Conçu pour la précision, notre (CRDO) Calculator DCF vous permet d'évaluer l'évaluation de Credo Technology Group Holding Ltd à l'aide de données financières authentiques, offrant une flexibilité complète pour modifier tous les paramètres clés pour des projections améliorées.
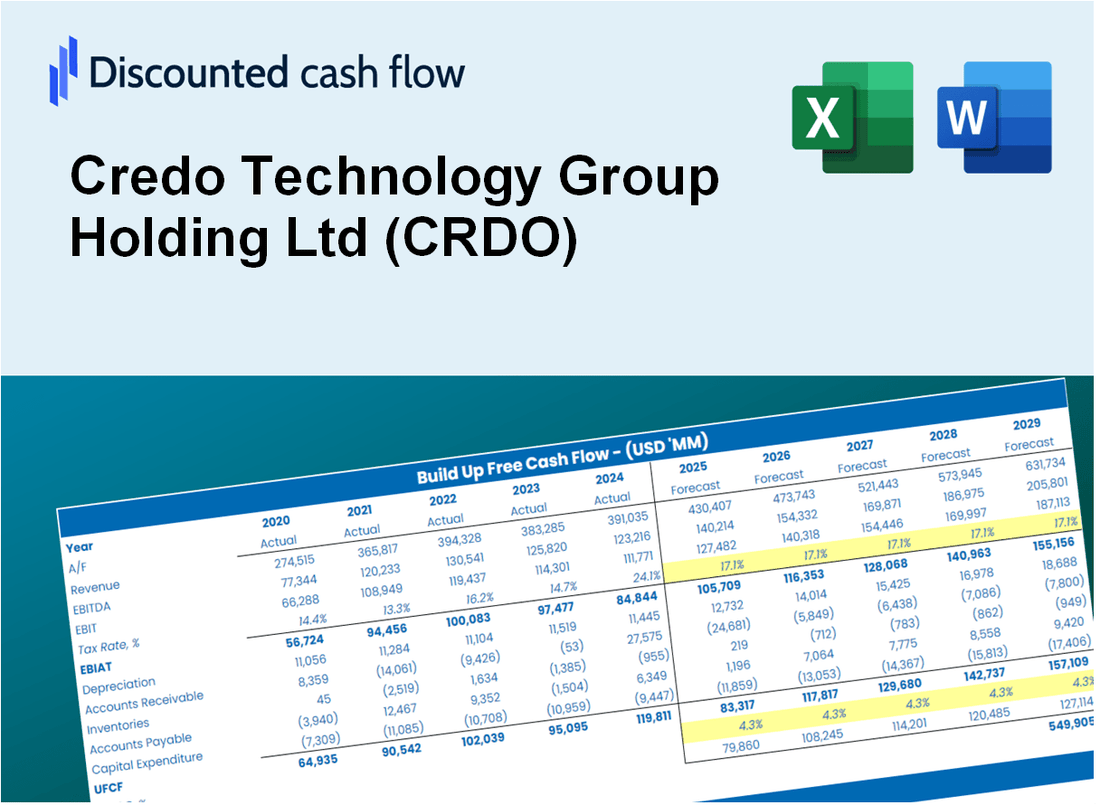
Discounted Cash Flow (DCF) - (USD MM)
| Year | AY1 2021 |
AY2 2022 |
AY3 2023 |
AY4 2024 |
AY5 2025 |
FY1 2026 |
FY2 2027 |
FY3 2028 |
FY4 2029 |
FY5 2030 |
|---|---|---|---|---|---|---|---|---|---|---|
| Revenue | 58.7 | 106.5 | 184.2 | 193.0 | 436.8 | 719.8 | 1,186.1 | 1,954.5 | 3,220.8 | 5,307.6 |
| Revenue Growth, % | 0 | 81.4 | 72.99 | 4.76 | 126.34 | 64.79 | 64.79 | 64.79 | 64.79 | 64.79 |
| EBITDA | -23.0 | -14.0 | -9.3 | -22.5 | 59.9 | -79.8 | -131.4 | -216.6 | -356.9 | -588.1 |
| EBITDA, % | -39.21 | -13.19 | -5.06 | -11.67 | 13.72 | -11.08 | -11.08 | -11.08 | -11.08 | -11.08 |
| Depreciation | 2.2 | 4.8 | 9.5 | 13.8 | 21.9 | 36.9 | 60.7 | 100.1 | 164.9 | 271.8 |
| Depreciation, % | 3.78 | 4.5 | 5.17 | 7.14 | 5.02 | 5.12 | 5.12 | 5.12 | 5.12 | 5.12 |
| EBIT | -25.2 | -18.8 | -18.8 | -36.3 | 38.0 | -116.6 | -192.2 | -316.7 | -521.8 | -859.9 |
| EBIT, % | -42.99 | -17.69 | -10.22 | -18.81 | 8.7 | -16.2 | -16.2 | -16.2 | -16.2 | -16.2 |
| Total Cash | 103.8 | 259.3 | 217.8 | 410.0 | 431.3 | 718.0 | 1,183.1 | 1,949.7 | 3,212.8 | 5,294.4 |
| Total Cash, percent | .0 | .0 | .0 | .0 | .0 | .0 | .0 | .0 | .0 | .0 |
| Account Receivables | 18.2 | 39.6 | 59.0 | 81.2 | 162.1 | 258.3 | 425.7 | 701.5 | 1,155.9 | 1,904.8 |
| Account Receivables, % | 31.02 | 37.19 | 32.02 | 42.09 | 37.12 | 35.89 | 35.89 | 35.89 | 35.89 | 35.89 |
| Inventories | 7.1 | 27.3 | 46.0 | 25.9 | 90.0 | 139.3 | 229.6 | 378.4 | 623.6 | 1,027.6 |
| Inventories, % | 12.1 | 25.67 | 24.99 | 13.43 | 20.61 | 19.36 | 19.36 | 19.36 | 19.36 | 19.36 |
| Accounts Payable | 3.6 | 8.5 | 6.1 | 13.4 | 56.2 | 53.5 | 88.2 | 145.4 | 239.6 | 394.8 |
| Accounts Payable, % | 6.12 | 7.97 | 3.29 | 6.95 | 12.86 | 7.44 | 7.44 | 7.44 | 7.44 | 7.44 |
| Capital Expenditure | -6.1 | -17.6 | -21.7 | -15.7 | -36.1 | -79.1 | -130.4 | -214.9 | -354.2 | -583.7 |
| Capital Expenditure, % | -10.32 | -16.51 | -11.79 | -8.11 | -8.26 | -11 | -11 | -11 | -11 | -11 |
| Tax Rate, % | 4.9 | 4.9 | 4.9 | 4.9 | 4.9 | 4.9 | 4.9 | 4.9 | 4.9 | 4.9 |
| EBITAT | -27.4 | -18.8 | -17.4 | -45.3 | 36.1 | -113.7 | -187.3 | -308.6 | -508.6 | -838.1 |
| Depreciation | ||||||||||
| Changes in Account Receivables | ||||||||||
| Changes in Inventories | ||||||||||
| Changes in Accounts Payable | ||||||||||
| Capital Expenditure | ||||||||||
| UFCF | -53.0 | -68.3 | -70.1 | -41.9 | -80.3 | -304.0 | -479.9 | -790.9 | -1,303.3 | -2,147.6 |
| WACC, % | 15.85 | 15.85 | 15.84 | 15.85 | 15.84 | 15.84 | 15.84 | 15.84 | 15.84 | 15.84 |
| PV UFCF | ||||||||||
| SUM PV UFCF | -2,881.8 | |||||||||
| Long Term Growth Rate, % | 2.00 | |||||||||
| Free cash flow (T + 1) | -2,191 | |||||||||
| Terminal Value | -15,822 | |||||||||
| Present Terminal Value | -7,584 | |||||||||
| Enterprise Value | -10,466 | |||||||||
| Net Debt | -220 | |||||||||
| Equity Value | -10,245 | |||||||||
| Diluted Shares Outstanding, MM | 181 | |||||||||
| Equity Value Per Share | -56.55 |
What You Will Receive
- Adjustable Forecast Inputs: Swiftly modify key assumptions (growth %, margins, WACC) to explore various scenarios.
- Real-World Data: Credo Technology Group Holding Ltd's (CRDO) financial data pre-loaded to facilitate your analysis.
- Automated DCF Outputs: The template computes Net Present Value (NPV) and intrinsic value automatically.
- Customizable and Professional: A refined Excel model that caters to your valuation requirements.
- Designed for Analysts and Investors: Perfect for evaluating projections, confirming strategies, and enhancing efficiency.
Key Features
- 🔍 Real-Life CRDO Financials: Pre-filled historical and projected data for Credo Technology Group Holding Ltd.
- ✏️ Fully Customizable Inputs: Adjust all critical parameters (yellow cells) like WACC, growth %, and tax rates.
- 📊 Professional DCF Valuation: Built-in formulas calculate Credo’s intrinsic value using the Discounted Cash Flow method.
- ⚡ Instant Results: Visualize Credo’s valuation instantly after making changes.
- Scenario Analysis: Test and compare outcomes for various financial assumptions side-by-side.
How It Works
- Step 1: Download the prebuilt Excel template featuring Credo Technology Group Holding Ltd (CRDO) data.
- Step 2: Navigate through the pre-filled sheets to familiarize yourself with the key metrics.
- Step 3: Modify forecasts and assumptions in the editable yellow cells (WACC, growth, margins).
- Step 4: Instantly view updated results, including Credo Technology Group Holding Ltd (CRDO)’s intrinsic value.
- Step 5: Make well-informed investment decisions or create reports based on the outputs.
Why Choose This Calculator?
- Accurate Data: Up-to-date Credo Technology Group financials guarantee trustworthy valuation outcomes.
- Customizable: Modify essential parameters such as growth rates, WACC, and tax rates to align with your forecasts.
- Time-Saving: Pre-configured calculations save you the hassle of starting from scratch.
- Professional-Grade Tool: Tailored for investors, analysts, and consultants in the tech sector.
- User-Friendly: Simple design and clear instructions make it accessible for all users.
Who Should Use This Product?
- Individual Investors: Make informed decisions about buying or selling Credo Technology Group Holding Ltd (CRDO) stock.
- Financial Analysts: Streamline valuation processes with ready-to-use financial models for Credo Technology Group Holding Ltd (CRDO).
- Consultants: Deliver professional valuation insights for Credo Technology Group Holding Ltd (CRDO) to clients quickly and accurately.
- Business Owners: Understand how technology companies like Credo Technology Group Holding Ltd (CRDO) are valued to guide your own strategy.
- Finance Students: Learn valuation techniques using real-world data and scenarios related to Credo Technology Group Holding Ltd (CRDO).
What the Template Contains
- Preloaded CRDO Data: Historical and projected financial data, including revenue, EBIT, and capital expenditures.
- DCF and WACC Models: Professional-grade sheets for calculating intrinsic value and Weighted Average Cost of Capital.
- Editable Inputs: Yellow-highlighted cells for adjusting revenue growth, tax rates, and discount rates.
- Financial Statements: Comprehensive annual and quarterly financials for deeper analysis.
- Key Ratios: Profitability, leverage, and efficiency ratios to evaluate performance.
- Dashboard and Charts: Visual summaries of valuation outcomes and assumptions.
Disclaimer
All information, articles, and product details provided on this website are for general informational and educational purposes only. We do not claim any ownership over, nor do we intend to infringe upon, any trademarks, copyrights, logos, brand names, or other intellectual property mentioned or depicted on this site. Such intellectual property remains the property of its respective owners, and any references here are made solely for identification or informational purposes, without implying any affiliation, endorsement, or partnership.
We make no representations or warranties, express or implied, regarding the accuracy, completeness, or suitability of any content or products presented. Nothing on this website should be construed as legal, tax, investment, financial, medical, or other professional advice. In addition, no part of this site—including articles or product references—constitutes a solicitation, recommendation, endorsement, advertisement, or offer to buy or sell any securities, franchises, or other financial instruments, particularly in jurisdictions where such activity would be unlawful.
All content is of a general nature and may not address the specific circumstances of any individual or entity. It is not a substitute for professional advice or services. Any actions you take based on the information provided here are strictly at your own risk. You accept full responsibility for any decisions or outcomes arising from your use of this website and agree to release us from any liability in connection with your use of, or reliance upon, the content or products found herein.