
|
Corvus Pharmaceuticals, Inc. (CRVS) Évaluation DCF |
Entièrement Modifiable: Adapté À Vos Besoins Dans Excel Ou Sheets
Conception Professionnelle: Modèles Fiables Et Conformes Aux Normes Du Secteur
Pré-Construits Pour Une Utilisation Rapide Et Efficace
Compatible MAC/PC, entièrement débloqué
Aucune Expertise N'Est Requise; Facile À Suivre
Corvus Pharmaceuticals, Inc. (CRVS) Bundle
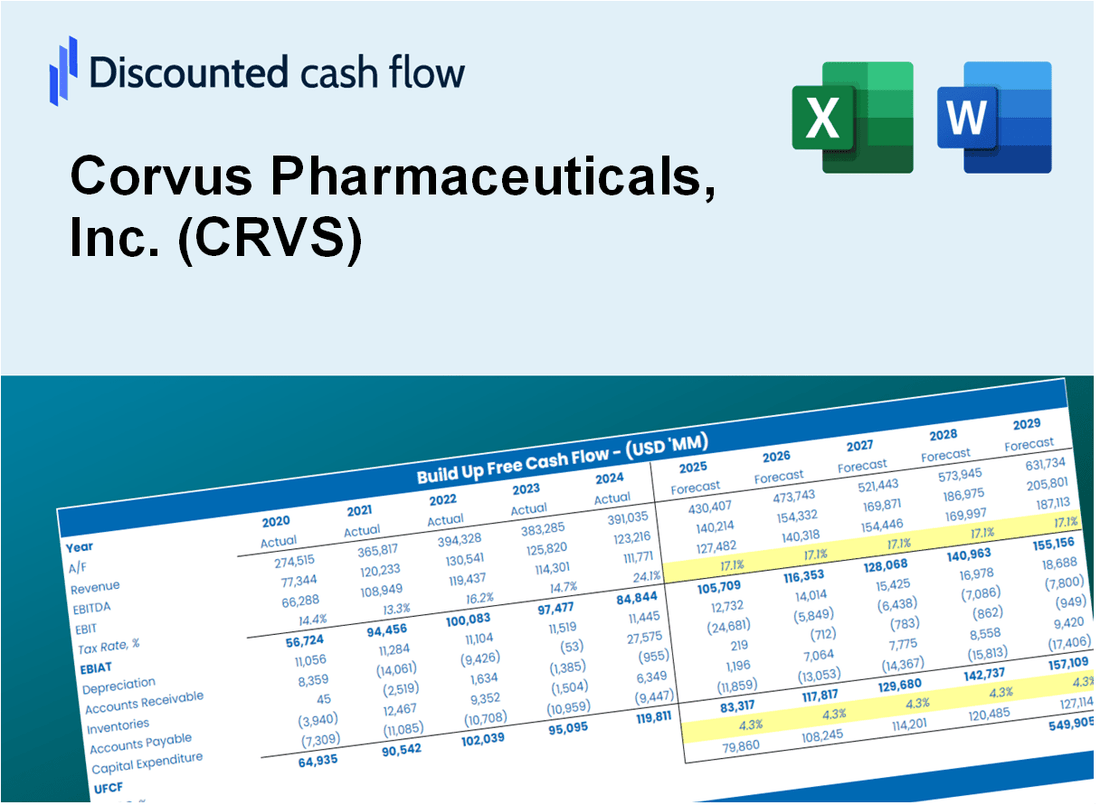
Évaluez les perspectives financières de Corvus Pharmaceuticals, Inc. (CRVS) comme un expert! Cette calculatrice DCF (CRVS) vous fournit des données financières pré-remplies et une flexibilité totale pour modifier la croissance des revenus, le WACC, les marges et d'autres hypothèses essentielles pour s'aligner sur vos prévisions.
What You Will Get
- Comprehensive CRVS Financials: Access to historical and projected data for precise valuation.
- Customizable Variables: Adjust inputs like WACC, tax rates, revenue growth, and capital expenditures.
- Dynamic Calculations: Intrinsic value and NPV are computed automatically.
- Scenario Testing: Evaluate various scenarios to assess Corvus Pharmaceuticals' future performance.
- User-Friendly Interface: Designed for professionals while remaining approachable for newcomers.
Key Features
- Comprehensive Financial Data: Gain access to precise pre-loaded historical performance and future forecasts for Corvus Pharmaceuticals, Inc. (CRVS).
- Adjustable Forecast Parameters: Modify highlighted cells for variables such as discount rates, growth expectations, and profit margins.
- Real-Time Calculations: Enjoy automatic updates for DCF, Net Present Value (NPV), and cash flow assessments.
- Interactive Dashboard: Utilize clear, visually appealing charts and summaries to interpret your valuation findings.
- Designed for All Skill Levels: A user-friendly format tailored for investors, CFOs, and consultants alike.
How It Works
- Step 1: Download the prebuilt Excel template with Corvus Pharmaceuticals, Inc. (CRVS) data included.
- Step 2: Explore the pre-filled sheets and understand the key metrics specific to Corvus Pharmaceuticals.
- Step 3: Update forecasts and assumptions in the editable yellow cells (WACC, growth, margins).
- Step 4: Instantly view recalculated results, including Corvus Pharmaceuticals' intrinsic value.
- Step 5: Make informed investment decisions or generate reports using the outputs.
Why Choose This Calculator for Corvus Pharmaceuticals (CRVS)?
- User-Friendly Interface: Tailored for both novice and seasoned users.
- Customizable Inputs: Modify parameters effortlessly to suit your analysis needs.
- Real-Time Valuation: Observe immediate updates to Corvus’s valuation with input adjustments.
- Preloaded Data: Comes equipped with Corvus’s actual financial metrics for swift evaluations.
- Relied Upon by Experts: A go-to tool for investors and analysts seeking to make data-driven choices.
Who Should Use This Product?
- Investors: Accurately estimate Corvus Pharmaceuticals’ fair value before making investment decisions.
- CFOs: Leverage a professional-grade DCF model for financial reporting and analysis related to Corvus Pharmaceuticals (CRVS).
- Consultants: Quickly adapt the template for valuation reports tailored to Corvus Pharmaceuticals (CRVS) clients.
- Entrepreneurs: Gain insights into financial modeling techniques utilized by leading biotech firms like Corvus Pharmaceuticals (CRVS).
- Educators: Use it as a teaching tool to illustrate valuation methodologies relevant to the biotech sector, including Corvus Pharmaceuticals (CRVS).
What the Template Contains
- Operating and Balance Sheet Data: Pre-filled Corvus Pharmaceuticals historical data and forecasts, including revenue, EBITDA, EBIT, and capital expenditures.
- WACC Calculation: A dedicated sheet for Weighted Average Cost of Capital (WACC), including parameters like Beta, risk-free rate, and share price.
- DCF Valuation (Unlevered and Levered): Editable Discounted Cash Flow models showing intrinsic value with detailed calculations.
- Financial Statements: Pre-loaded financial statements (annual and quarterly) to support analysis.
- Key Ratios: Includes profitability, leverage, and efficiency ratios for Corvus Pharmaceuticals, Inc. (CRVS).
- Dashboard and Charts: Visual summary of valuation outputs and assumptions to analyze results easily.
Disclaimer
All information, articles, and product details provided on this website are for general informational and educational purposes only. We do not claim any ownership over, nor do we intend to infringe upon, any trademarks, copyrights, logos, brand names, or other intellectual property mentioned or depicted on this site. Such intellectual property remains the property of its respective owners, and any references here are made solely for identification or informational purposes, without implying any affiliation, endorsement, or partnership.
We make no representations or warranties, express or implied, regarding the accuracy, completeness, or suitability of any content or products presented. Nothing on this website should be construed as legal, tax, investment, financial, medical, or other professional advice. In addition, no part of this site—including articles or product references—constitutes a solicitation, recommendation, endorsement, advertisement, or offer to buy or sell any securities, franchises, or other financial instruments, particularly in jurisdictions where such activity would be unlawful.
All content is of a general nature and may not address the specific circumstances of any individual or entity. It is not a substitute for professional advice or services. Any actions you take based on the information provided here are strictly at your own risk. You accept full responsibility for any decisions or outcomes arising from your use of this website and agree to release us from any liability in connection with your use of, or reliance upon, the content or products found herein.