
|
Costar Group, Inc. (CSGP) Évaluation DCF |
Entièrement Modifiable: Adapté À Vos Besoins Dans Excel Ou Sheets
Conception Professionnelle: Modèles Fiables Et Conformes Aux Normes Du Secteur
Pré-Construits Pour Une Utilisation Rapide Et Efficace
Compatible MAC/PC, entièrement débloqué
Aucune Expertise N'Est Requise; Facile À Suivre
CoStar Group, Inc. (CSGP) Bundle
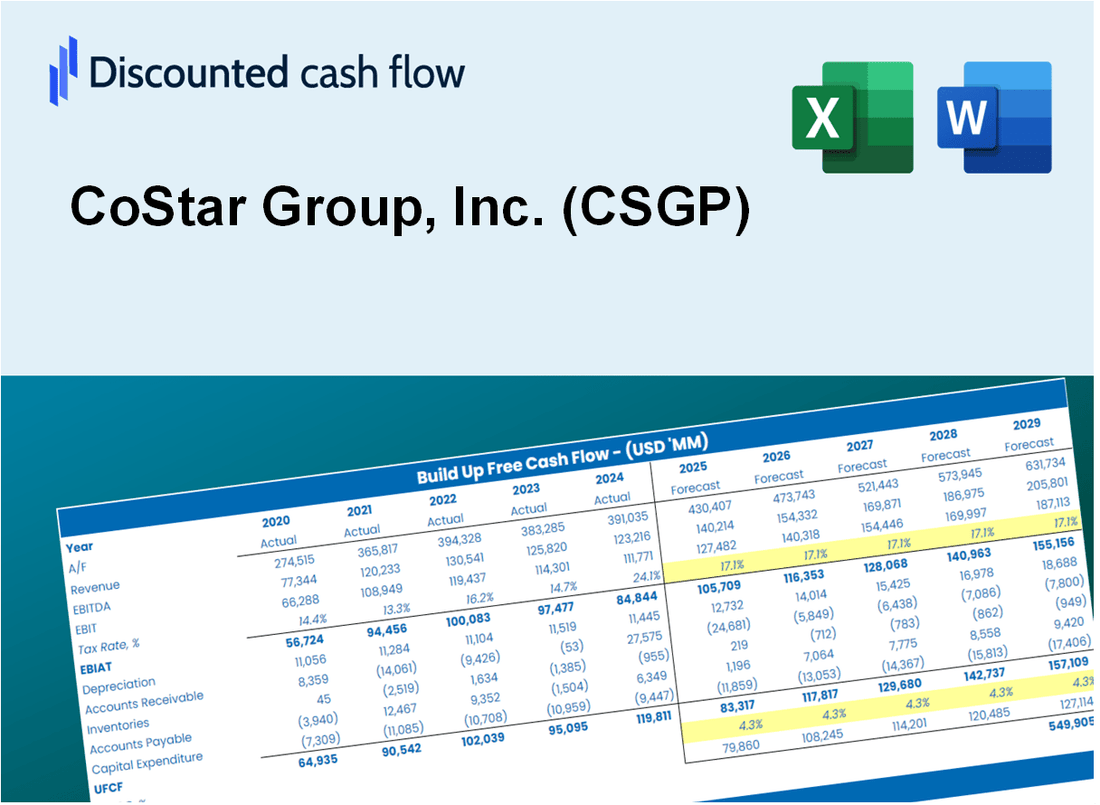
Découvrez le véritable potentiel de Costar Group, Inc. (CSGP) avec notre calculatrice avancée DCF! Ajustez les hypothèses clés, explorez divers scénarios et évaluez comment les changements affectent l'évaluation Costar Group, Inc. (CSGP) - le tout dans un seul modèle Excel.
What You Will Receive
- Flexible Forecast Inputs: Effortlessly adjust parameters (growth %, margins, WACC) to explore various scenarios.
- Real-World Data: CoStar Group, Inc.'s (CSGP) financial data pre-loaded to facilitate your analysis.
- Automated DCF Outputs: The template computes Net Present Value (NPV) and intrinsic value automatically.
- Customizable and Professional: A sleek Excel model tailored to meet your valuation requirements.
- Designed for Analysts and Investors: Perfect for evaluating forecasts, confirming strategies, and enhancing efficiency.
Key Features
- Comprehensive Data: CoStar Group's extensive historical data and market analysis.
- Customizable Parameters: Modify inputs like growth rates, operating margins, and market assumptions.
- Real-Time Insights: View CoStar Group’s financial metrics update instantly.
- Intuitive Visualizations: Interactive dashboards present valuation outcomes and essential indicators.
- Designed for Precision: A reliable resource for analysts, investors, and finance professionals.
How It Functions
- Download the Template: Gain immediate access to the Excel-based CSGP DCF Calculator.
- Input Your Assumptions: Modify the yellow-highlighted cells for growth rates, WACC, margins, and more.
- Instant Calculations: The model automatically recalculates CoStar Group’s intrinsic value.
- Test Scenarios: Experiment with various assumptions to assess potential valuation shifts.
- Analyze and Decide: Utilize the results to inform your investment or financial analysis.
Why Choose This Calculator for CoStar Group, Inc. (CSGP)?
- User-Friendly Interface: Tailored for both novice and seasoned users.
- Customizable Inputs: Easily adjust parameters to suit your financial analysis.
- Real-Time Valuation: Observe immediate updates to CoStar's valuation as you modify inputs.
- Preloaded Data: Comes equipped with CoStar’s actual financial metrics for swift evaluation.
- Preferred by Experts: Trusted by investors and analysts for making well-informed decisions.
Who Should Use This Product?
- Real Estate Investors: Assess CoStar Group’s valuation before making investment decisions.
- Financial Analysts: Enhance valuation methodologies and evaluate market trends.
- Property Managers: Understand how leading firms like CoStar are appraised.
- Consultants: Provide comprehensive valuation assessments for clients in the real estate sector.
- Students and Educators: Utilize real-time data to learn and teach valuation practices.
What the Template Contains
- Comprehensive DCF Model: Editable template featuring detailed valuation calculations tailored for CoStar Group, Inc. (CSGP).
- Real-World Data: CoStar Group’s historical and projected financials preloaded for thorough analysis.
- Customizable Parameters: Modify WACC, growth rates, and tax assumptions to explore various scenarios.
- Financial Statements: Complete annual and quarterly breakdowns for enhanced insights into performance.
- Key Ratios: Integrated analysis for profitability, efficiency, and leverage specific to CoStar Group, Inc. (CSGP).
- Dashboard with Visual Outputs: Interactive charts and tables designed for clear, actionable results.
Disclaimer
All information, articles, and product details provided on this website are for general informational and educational purposes only. We do not claim any ownership over, nor do we intend to infringe upon, any trademarks, copyrights, logos, brand names, or other intellectual property mentioned or depicted on this site. Such intellectual property remains the property of its respective owners, and any references here are made solely for identification or informational purposes, without implying any affiliation, endorsement, or partnership.
We make no representations or warranties, express or implied, regarding the accuracy, completeness, or suitability of any content or products presented. Nothing on this website should be construed as legal, tax, investment, financial, medical, or other professional advice. In addition, no part of this site—including articles or product references—constitutes a solicitation, recommendation, endorsement, advertisement, or offer to buy or sell any securities, franchises, or other financial instruments, particularly in jurisdictions where such activity would be unlawful.
All content is of a general nature and may not address the specific circumstances of any individual or entity. It is not a substitute for professional advice or services. Any actions you take based on the information provided here are strictly at your own risk. You accept full responsibility for any decisions or outcomes arising from your use of this website and agree to release us from any liability in connection with your use of, or reliance upon, the content or products found herein.