
|
AXA SA (CS.PA) Évaluation DCF |
Entièrement Modifiable: Adapté À Vos Besoins Dans Excel Ou Sheets
Conception Professionnelle: Modèles Fiables Et Conformes Aux Normes Du Secteur
Pré-Construits Pour Une Utilisation Rapide Et Efficace
Compatible MAC/PC, entièrement débloqué
Aucune Expertise N'Est Requise; Facile À Suivre
AXA SA (CS.PA) Bundle
Explorez les perspectives financières d'AXA SA (CSPA) avec notre calculatrice DCF conviviale! Entrez vos hypothèses pour la croissance, les marges et les coûts pour calculer la valeur intrinsèque de AXA SA (CSPA) et affiner votre stratégie d'investissement.
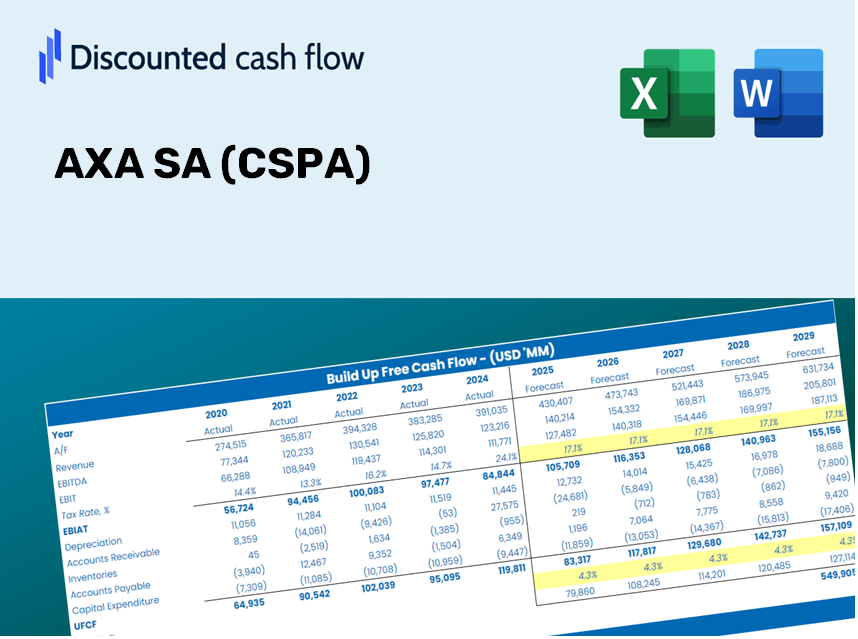
Discounted Cash Flow (DCF) - (USD MM)
| Year | AY1 2020 |
AY2 2021 |
AY3 2022 |
AY4 2023 |
AY5 2024 |
FY1 2025 |
FY2 2026 |
FY3 2027 |
FY4 2028 |
FY5 2029 |
|---|---|---|---|---|---|---|---|---|---|---|
| Revenue | 112,347.0 | 122,171.0 | 93,083.0 | 86,015.0 | 89,823.0 | 85,729.1 | 81,821.8 | 78,092.5 | 74,533.3 | 71,136.2 |
| Revenue Growth, % | 0 | 8.74 | -23.81 | -7.59 | 4.43 | -4.56 | -4.56 | -4.56 | -4.56 | -4.56 |
| EBITDA | 6,526.0 | 10,384.0 | 6,579.0 | 9,210.0 | 10,412.0 | 7,488.5 | 7,147.2 | 6,821.4 | 6,510.5 | 6,213.8 |
| EBITDA, % | 5.81 | 8.5 | 7.07 | 10.71 | 11.59 | 8.74 | 8.74 | 8.74 | 8.74 | 8.74 |
| Depreciation | 1,176.0 | 870.0 | -805.0 | -285.0 | -173.0 | 63.5 | 60.6 | 57.8 | 55.2 | 52.7 |
| Depreciation, % | 1.05 | 0.71212 | -0.86482 | -0.33134 | -0.1926 | 0.07402308 | 0.07402308 | 0.07402308 | 0.07402308 | 0.07402308 |
| EBIT | 5,350.0 | 9,514.0 | 7,384.0 | 9,495.0 | 10,585.0 | 7,425.0 | 7,086.6 | 6,763.6 | 6,455.4 | 6,161.1 |
| EBIT, % | 4.76 | 7.79 | 7.93 | 11.04 | 11.78 | 8.66 | 8.66 | 8.66 | 8.66 | 8.66 |
| Total Cash | 28,237.0 | 25,051.0 | 323,683.0 | 320,119.0 | 333,567.0 | 59,262.6 | 56,561.5 | 53,983.6 | 51,523.2 | 49,174.9 |
| Total Cash, percent | .0 | .0 | .0 | .0 | .0 | .0 | .0 | .0 | .0 | .0 |
| Account Receivables | .0 | .0 | .0 | .0 | 9,899.0 | 1,889.6 | 1,803.4 | 1,721.2 | 1,642.8 | 1,567.9 |
| Account Receivables, % | 0 | 0 | 0 | 0 | 11.02 | 2.2 | 2.2 | 2.2 | 2.2 | 2.2 |
| Inventories | .0 | .0 | .0 | .0 | .0 | .0 | .0 | .0 | .0 | .0 |
| Inventories, % | 0 | 0 | 0 | 0 | 0 | 0 | 0 | 0 | 0 | 0 |
| Accounts Payable | 24,049.0 | 21,256.0 | .0 | .0 | .0 | 6,653.4 | 6,350.1 | 6,060.7 | 5,784.5 | 5,520.8 |
| Accounts Payable, % | 21.41 | 17.4 | 0 | 0 | 0 | 7.76 | 7.76 | 7.76 | 7.76 | 7.76 |
| Capital Expenditure | -389.0 | -350.0 | -353.0 | -427.0 | -476.0 | -349.5 | -333.6 | -318.4 | -303.8 | -290.0 |
| Capital Expenditure, % | -0.34625 | -0.28648 | -0.37923 | -0.49643 | -0.52993 | -0.40766 | -0.40766 | -0.40766 | -0.40766 | -0.40766 |
| Tax Rate, % | 20.97 | 20.97 | 20.97 | 20.97 | 20.97 | 20.97 | 20.97 | 20.97 | 20.97 | 20.97 |
| EBITAT | 3,474.4 | 7,545.4 | 5,658.8 | 7,681.7 | 8,365.7 | 5,655.3 | 5,397.5 | 5,151.5 | 4,916.7 | 4,692.6 |
| Depreciation | ||||||||||
| Changes in Account Receivables | ||||||||||
| Changes in Inventories | ||||||||||
| Changes in Accounts Payable | ||||||||||
| Capital Expenditure | ||||||||||
| UFCF | 28,310.4 | 5,272.4 | -16,755.2 | 6,969.7 | -2,182.3 | 20,032.0 | 4,907.4 | 4,683.7 | 4,470.3 | 4,266.5 |
| WACC, % | 4.95 | 5.18 | 5.14 | 5.2 | 5.17 | 5.13 | 5.13 | 5.13 | 5.13 | 5.13 |
| PV UFCF | ||||||||||
| SUM PV UFCF | 34,508.3 | |||||||||
| Long Term Growth Rate, % | 2.00 | |||||||||
| Free cash flow (T + 1) | 4,352 | |||||||||
| Terminal Value | 139,091 | |||||||||
| Present Terminal Value | 108,316 | |||||||||
| Enterprise Value | 142,824 | |||||||||
| Net Debt | 43,152 | |||||||||
| Equity Value | 99,672 | |||||||||
| Diluted Shares Outstanding, MM | 2,197 | |||||||||
| Equity Value Per Share | 45.37 |
What You Will Receive
- Authentic AXA SA Financial Data: Pre-loaded with the historical and forecasted data for precise analysis of AXA SA.
- Completely Customizable Template: Easily adjust critical inputs such as revenue growth, WACC, and EBITDA %.
- Instantaneous Calculations: Observe AXA SA's intrinsic value update in real-time as you make changes.
- Expert Valuation Tool: Tailored for investors, analysts, and consultants aiming for accurate DCF results.
- User-Friendly Interface: Intuitive layout and straightforward instructions suitable for all skill levels.
Key Features
- Comprehensive DCF Calculator: Features detailed unlevered and levered DCF valuation models tailored for AXA SA (CSPA).
- WACC Calculator: Includes a pre-built Weighted Average Cost of Capital sheet with customizable parameters specific to AXA SA (CSPA).
- Flexible Forecast Assumptions: Adjust growth rates, capital expenditures, and discount rates to suit AXA SA (CSPA) projections.
- Integrated Financial Ratios: Evaluate profitability, leverage, and efficiency ratios applicable to AXA SA (CSPA).
- Interactive Dashboard and Charts: Visual summaries provide insights into key valuation metrics for straightforward analysis of AXA SA (CSPA).
How It Works
- Step 1: Download the Excel file for AXA SA (CSPA).
- Step 2: Examine the pre-filled financial data and forecasts for AXA SA.
- Step 3: Adjust key variables such as revenue growth, WACC, and tax rates (highlighted cells).
- Step 4: Observe the DCF model refresh in real-time as you modify your assumptions.
- Step 5: Evaluate the outputs and leverage the findings for your investment strategies.
Why Opt for This AXA SA (CSAP) Calculator?
- Precision: Utilizes authentic AXA financial data to ensure high accuracy.
- Versatility: Built to allow users to easily test and adjust inputs as needed.
- Efficiency: Eliminate the complexity of creating a DCF model from the ground up.
- Expert-Quality: Crafted with the expertise and usability standards of CFOs in mind.
- Intuitive: Simple interface, ideal for users with varying levels of financial modeling experience.
Who Can Benefit from This Product?
- Individual Investors: Make informed choices about trading AXA SA (CSPA) shares.
- Financial Analysts: Enhance valuation methodologies with accessible financial models.
- Consultants: Provide clients with expert valuation insights promptly and accurately.
- Business Owners: Gain insights into how major firms like AXA SA (CSPA) are valued to inform your own business strategies.
- Finance Students: Master valuation techniques using authentic data and real-world examples.
What the Template Contains
- Historical Data: Includes AXA SA’s past financials and baseline forecasts.
- DCF and Levered DCF Models: Detailed templates to calculate AXA SA’s intrinsic value.
- WACC Sheet: Pre-built calculations for Weighted Average Cost of Capital.
- Editable Inputs: Modify key drivers like growth rates, EBITDA %, and CAPEX assumptions.
- Quarterly and Annual Statements: A complete breakdown of AXA SA’s financials.
- Interactive Dashboard: Visualize valuation results and projections dynamically.
Disclaimer
All information, articles, and product details provided on this website are for general informational and educational purposes only. We do not claim any ownership over, nor do we intend to infringe upon, any trademarks, copyrights, logos, brand names, or other intellectual property mentioned or depicted on this site. Such intellectual property remains the property of its respective owners, and any references here are made solely for identification or informational purposes, without implying any affiliation, endorsement, or partnership.
We make no representations or warranties, express or implied, regarding the accuracy, completeness, or suitability of any content or products presented. Nothing on this website should be construed as legal, tax, investment, financial, medical, or other professional advice. In addition, no part of this site—including articles or product references—constitutes a solicitation, recommendation, endorsement, advertisement, or offer to buy or sell any securities, franchises, or other financial instruments, particularly in jurisdictions where such activity would be unlawful.
All content is of a general nature and may not address the specific circumstances of any individual or entity. It is not a substitute for professional advice or services. Any actions you take based on the information provided here are strictly at your own risk. You accept full responsibility for any decisions or outcomes arising from your use of this website and agree to release us from any liability in connection with your use of, or reliance upon, the content or products found herein.