
|
Capital Southwest Corporation (CSWC) Évaluation DCF |
Entièrement Modifiable: Adapté À Vos Besoins Dans Excel Ou Sheets
Conception Professionnelle: Modèles Fiables Et Conformes Aux Normes Du Secteur
Pré-Construits Pour Une Utilisation Rapide Et Efficace
Compatible MAC/PC, entièrement débloqué
Aucune Expertise N'Est Requise; Facile À Suivre
Capital Southwest Corporation (CSWC) Bundle
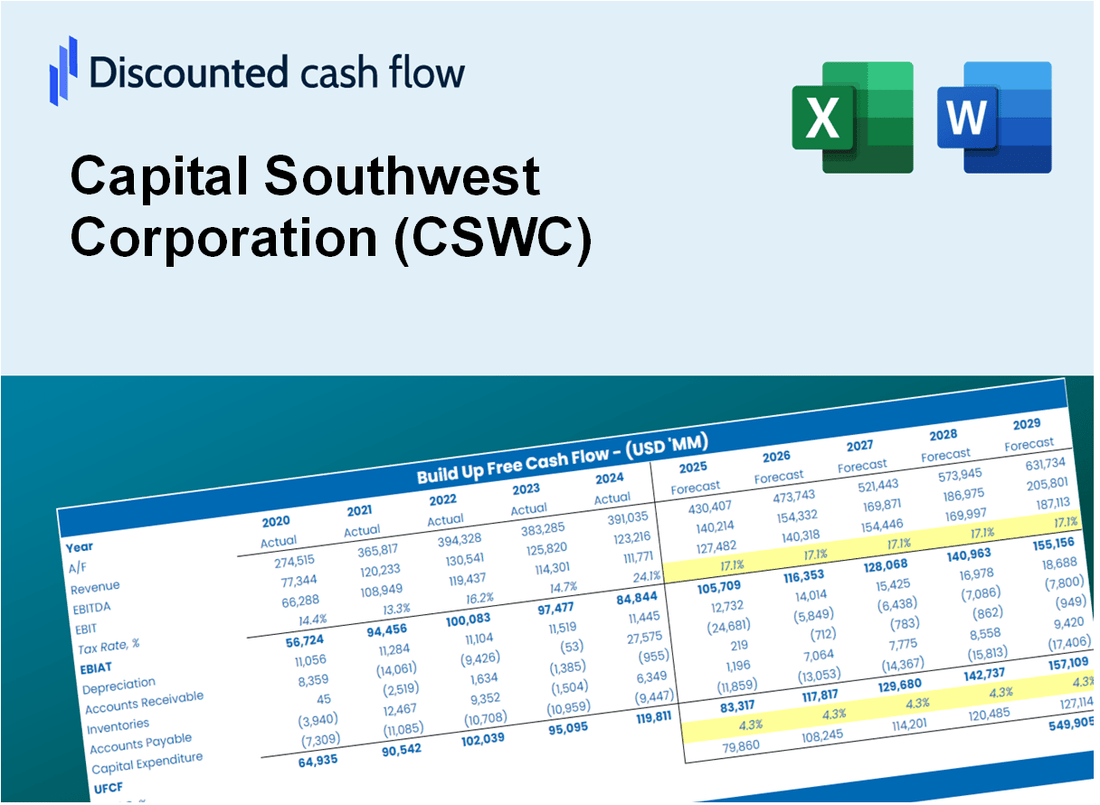
Découvrez le véritable potentiel de Capital Southwest Corporation (CSWC) avec notre calculatrice avancée DCF! Ajustez les hypothèses essentielles, explorez divers scénarios et évaluez comment les différents facteurs affectent la valorisation Capital Southwest Corporation (CSWC) - le tout dans un modèle Excel convivial.
Discounted Cash Flow (DCF) - (USD MM)
| Year | AY1 2021 |
AY2 2022 |
AY3 2023 |
AY4 2024 |
AY5 2025 |
FY1 2026 |
FY2 2027 |
FY3 2028 |
FY4 2029 |
FY5 2030 |
|---|---|---|---|---|---|---|---|---|---|---|
| Revenue | 72.6 | 102.9 | 90.3 | 152.1 | 163.8 | 207.1 | 261.8 | 331.0 | 418.4 | 529.0 |
| Revenue Growth, % | 0 | 41.82 | -12.24 | 68.44 | 7.67 | 26.42 | 26.42 | 26.42 | 26.42 | 26.42 |
| EBITDA | 57.5 | 49.1 | 42.8 | 88.9 | 85.3 | 118.0 | 149.1 | 188.6 | 238.4 | 301.4 |
| EBITDA, % | 79.27 | 47.68 | 47.4 | 58.43 | 52.06 | 56.97 | 56.97 | 56.97 | 56.97 | 56.97 |
| Depreciation | 2.0 | 2.2 | 2.8 | 4.3 | 5.9 | 5.9 | 7.5 | 9.5 | 12.0 | 15.2 |
| Depreciation, % | 2.71 | 2.17 | 3.04 | 2.83 | 3.58 | 2.87 | 2.87 | 2.87 | 2.87 | 2.87 |
| EBIT | 55.6 | 46.8 | 40.1 | 84.6 | 79.4 | 112.0 | 141.6 | 179.1 | 226.4 | 286.2 |
| EBIT, % | 76.56 | 45.51 | 44.36 | 55.6 | 48.48 | 54.1 | 54.1 | 54.1 | 54.1 | 54.1 |
| Total Cash | 31.6 | 11.4 | 21.6 | 32.3 | 43.2 | 52.3 | 66.1 | 83.5 | 105.6 | 133.5 |
| Total Cash, percent | .0 | .0 | .0 | .0 | .0 | .0 | .0 | .0 | .0 | .0 |
| Account Receivables | 10.7 | 14.3 | 19.1 | 30.2 | 32.3 | 37.0 | 46.8 | 59.2 | 74.8 | 94.6 |
| Account Receivables, % | 14.75 | 13.94 | 21.12 | 19.85 | 19.73 | 17.88 | 17.88 | 17.88 | 17.88 | 17.88 |
| Inventories | .0 | .0 | .0 | .0 | .0 | .0 | .0 | .0 | .0 | .0 |
| Inventories, % | 0 | 0 | 0 | 0 | 0 | 0 | 0 | 0 | 0 | 0 |
| Accounts Payable | .0 | .0 | .0 | .0 | .0 | .0 | .0 | .0 | .0 | .0 |
| Accounts Payable, % | 0 | 0 | 0 | 0 | 0 | 0 | 0 | 0 | 0 | 0 |
| Capital Expenditure | .0 | -2.0 | -.3 | .0 | .0 | -.9 | -1.2 | -1.5 | -1.9 | -2.4 |
| Capital Expenditure, % | 0 | -1.94 | -0.3111 | -0.00854426 | 0 | -0.45159 | -0.45159 | -0.45159 | -0.45159 | -0.45159 |
| Tax Rate, % | 11.16 | 11.16 | 11.16 | 11.16 | 11.16 | 11.16 | 11.16 | 11.16 | 11.16 | 11.16 |
| EBITAT | 50.9 | 42.8 | 33.1 | 83.4 | 70.5 | 101.5 | 128.3 | 162.2 | 205.1 | 259.3 |
| Depreciation | ||||||||||
| Changes in Account Receivables | ||||||||||
| Changes in Inventories | ||||||||||
| Changes in Accounts Payable | ||||||||||
| Capital Expenditure | ||||||||||
| UFCF | 42.1 | 39.4 | 30.8 | 76.6 | 74.3 | 101.8 | 124.9 | 157.9 | 199.6 | 252.3 |
| WACC, % | 6.47 | 6.47 | 6.23 | 6.66 | 6.4 | 6.44 | 6.44 | 6.44 | 6.44 | 6.44 |
| PV UFCF | ||||||||||
| SUM PV UFCF | 676.8 | |||||||||
| Long Term Growth Rate, % | 2.00 | |||||||||
| Free cash flow (T + 1) | 257 | |||||||||
| Terminal Value | 5,791 | |||||||||
| Present Terminal Value | 4,238 | |||||||||
| Enterprise Value | 4,914 | |||||||||
| Net Debt | 913 | |||||||||
| Equity Value | 4,002 | |||||||||
| Diluted Shares Outstanding, MM | 51 | |||||||||
| Equity Value Per Share | 78.18 |
What You Will Receive
- Authentic CSWC Data: Preloaded financial metrics – from revenue to EBIT – derived from real and forecasted figures.
- Comprehensive Customization: Modify all essential parameters (yellow cells) such as WACC, growth %, and tax rates.
- Instant Valuation Updates: Automatic recalculations to assess the effects of changes on Capital Southwest Corporation’s (CSWC) fair value.
- Flexible Excel Template: Designed for quick modifications, scenario analysis, and in-depth projections.
- Efficient and Precise: Eliminate the need to build models from the ground up while ensuring accuracy and adaptability.
Key Features
- Comprehensive Historical Data: Access Capital Southwest Corporation’s (CSWC) past financial statements and pre-filled projections.
- Customizable Parameters: Modify WACC, tax rates, revenue growth, and EBITDA margins to suit your analysis.
- Real-Time Valuation: Witness the intrinsic value of Capital Southwest Corporation (CSWC) update instantly.
- Interactive Visualizations: Dashboard graphs illustrate valuation findings and essential metrics.
- Designed for Precision: A robust tool tailored for analysts, investors, and finance professionals.
How It Works
- 1. Access the Template: Download and open the Excel file containing Capital Southwest Corporation’s (CSWC) preloaded data.
- 2. Modify Assumptions: Adjust essential inputs such as growth projections, WACC, and capital expenditures.
- 3. Analyze Results Promptly: The DCF model automatically computes intrinsic value and NPV in real-time.
- 4. Explore Scenarios: Evaluate various forecasts to assess different valuation possibilities.
- 5. Present with Assurance: Deliver professional valuation insights to back your investment choices.
Why Choose This Calculator?
- User-Friendly Interface: Perfectly crafted for both novices and seasoned professionals.
- Customizable Inputs: Adjust parameters effortlessly to suit your financial analysis.
- Real-Time Updates: Instantly observe changes in Capital Southwest Corporation’s (CSWC) valuation as you tweak the inputs.
- Preloaded Data: Comes with actual financial information for Capital Southwest Corporation for swift evaluations.
- Relied Upon by Experts: A go-to tool for investors and analysts aiming for data-driven decisions.
Who Should Use This Product?
- Professional Investors: Develop comprehensive and trustworthy valuation models for portfolio management involving Capital Southwest Corporation (CSWC).
- Corporate Finance Teams: Evaluate valuation scenarios to inform strategic decisions within their organizations.
- Consultants and Advisors: Deliver precise valuation insights to clients regarding Capital Southwest Corporation (CSWC).
- Students and Educators: Utilize real-world data to enhance learning and practice in financial modeling.
- Finance Enthusiasts: Gain insights into how companies like Capital Southwest Corporation (CSWC) are valued in the financial markets.
What the Template Contains
- Operating and Balance Sheet Data: Pre-filled Capital Southwest Corporation (CSWC) historical data and forecasts, including revenue, EBITDA, EBIT, and capital expenditures.
- WACC Calculation: A dedicated sheet for Weighted Average Cost of Capital (WACC), incorporating parameters such as Beta, risk-free rate, and share price.
- DCF Valuation (Unlevered and Levered): Editable Discounted Cash Flow models that illustrate intrinsic value with comprehensive calculations.
- Financial Statements: Pre-loaded financial statements (annual and quarterly) to facilitate analysis.
- Key Ratios: Includes profitability, leverage, and efficiency ratios for Capital Southwest Corporation (CSWC).
- Dashboard and Charts: Visual summary of valuation outputs and assumptions for easy analysis of results.
Disclaimer
All information, articles, and product details provided on this website are for general informational and educational purposes only. We do not claim any ownership over, nor do we intend to infringe upon, any trademarks, copyrights, logos, brand names, or other intellectual property mentioned or depicted on this site. Such intellectual property remains the property of its respective owners, and any references here are made solely for identification or informational purposes, without implying any affiliation, endorsement, or partnership.
We make no representations or warranties, express or implied, regarding the accuracy, completeness, or suitability of any content or products presented. Nothing on this website should be construed as legal, tax, investment, financial, medical, or other professional advice. In addition, no part of this site—including articles or product references—constitutes a solicitation, recommendation, endorsement, advertisement, or offer to buy or sell any securities, franchises, or other financial instruments, particularly in jurisdictions where such activity would be unlawful.
All content is of a general nature and may not address the specific circumstances of any individual or entity. It is not a substitute for professional advice or services. Any actions you take based on the information provided here are strictly at your own risk. You accept full responsibility for any decisions or outcomes arising from your use of this website and agree to release us from any liability in connection with your use of, or reliance upon, the content or products found herein.