
|
CSW Industrials, Inc. (CSWI) Évaluation DCF |
Entièrement Modifiable: Adapté À Vos Besoins Dans Excel Ou Sheets
Conception Professionnelle: Modèles Fiables Et Conformes Aux Normes Du Secteur
Pré-Construits Pour Une Utilisation Rapide Et Efficace
Compatible MAC/PC, entièrement débloqué
Aucune Expertise N'Est Requise; Facile À Suivre
CSW Industrials, Inc. (CSWI) Bundle
Découvrez la valeur réelle de CSW Industrials, Inc. (CSWI) avec notre calculatrice avancée DCF! Ajustez les hypothèses cruciales, explorez divers scénarios et évaluez comment les différents changements affectent l'évaluation CSW Industrials, Inc. (CSWI) - le tout dans un modèle Excel pratique.
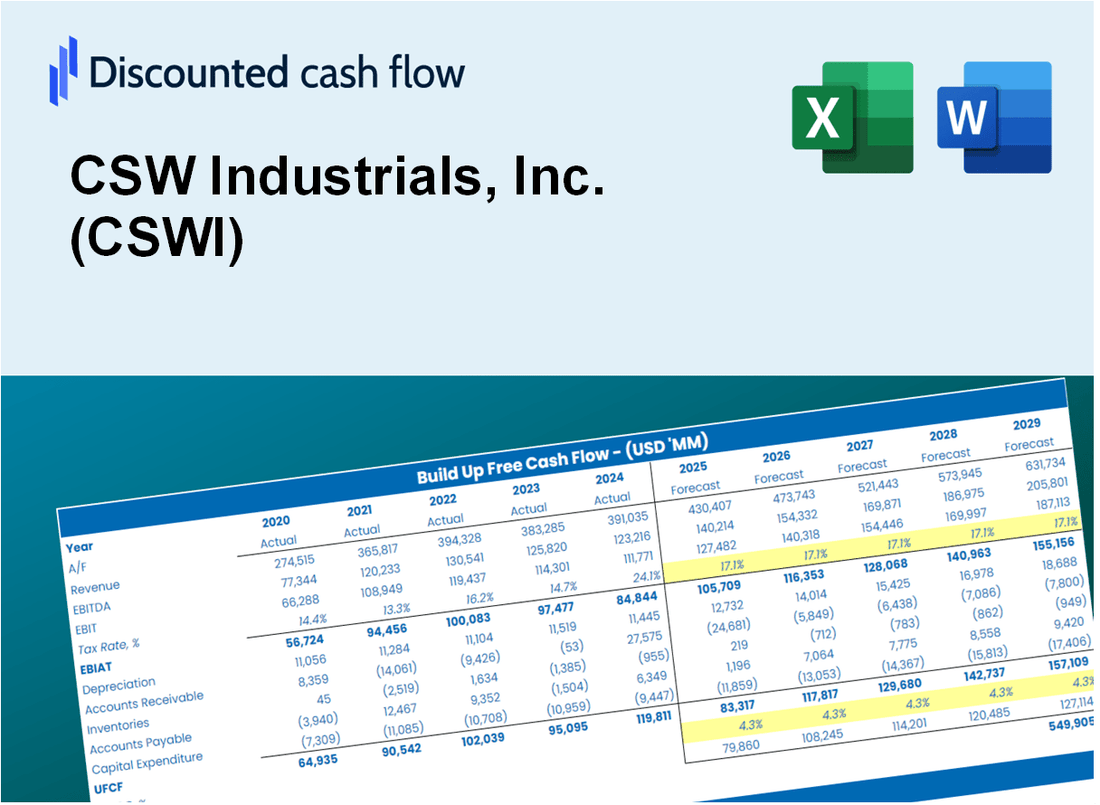
Discounted Cash Flow (DCF) - (USD MM)
| Year | AY1 2021 |
AY2 2022 |
AY3 2023 |
AY4 2024 |
AY5 2025 |
FY1 2026 |
FY2 2027 |
FY3 2028 |
FY4 2029 |
FY5 2030 |
|---|---|---|---|---|---|---|---|---|---|---|
| Revenue | 419.2 | 626.4 | 757.9 | 792.8 | 878.3 | 1,066.7 | 1,295.6 | 1,573.5 | 1,911.0 | 2,321.0 |
| Revenue Growth, % | 0 | 49.43 | 20.99 | 4.61 | 10.78 | 21.45 | 21.45 | 21.45 | 21.45 | 21.45 |
| EBITDA | 76.3 | 133.1 | 174.7 | 192.0 | 223.4 | 239.3 | 290.6 | 352.9 | 428.6 | 520.6 |
| EBITDA, % | 18.2 | 21.24 | 23.05 | 24.22 | 25.43 | 22.43 | 22.43 | 22.43 | 22.43 | 22.43 |
| Depreciation | 23.0 | 36.4 | 35.6 | 37.6 | 43.0 | 54.7 | 66.4 | 80.7 | 98.0 | 119.0 |
| Depreciation, % | 5.5 | 5.81 | 4.69 | 4.75 | 4.9 | 5.13 | 5.13 | 5.13 | 5.13 | 5.13 |
| EBIT | 53.3 | 96.7 | 139.2 | 154.4 | 180.4 | 184.6 | 224.2 | 272.2 | 330.7 | 401.6 |
| EBIT, % | 12.7 | 15.43 | 18.36 | 19.47 | 20.54 | 17.3 | 17.3 | 17.3 | 17.3 | 17.3 |
| Total Cash | 10.1 | 16.6 | 18.5 | 22.2 | 225.8 | 76.8 | 93.3 | 113.3 | 137.6 | 167.1 |
| Total Cash, percent | .0 | .0 | .0 | .0 | .0 | .0 | .0 | .0 | .0 | .0 |
| Account Receivables | 96.7 | 122.8 | 122.8 | 142.7 | 157.7 | 202.3 | 245.7 | 298.4 | 362.4 | 440.2 |
| Account Receivables, % | 23.07 | 19.6 | 16.2 | 17.99 | 17.96 | 18.96 | 18.96 | 18.96 | 18.96 | 18.96 |
| Inventories | 98.1 | 150.1 | 161.6 | 150.7 | 194.9 | 234.4 | 284.7 | 345.8 | 420.0 | 510.1 |
| Inventories, % | 23.4 | 23.96 | 21.32 | 19.01 | 22.19 | 21.98 | 21.98 | 21.98 | 21.98 | 21.98 |
| Accounts Payable | 32.4 | 47.8 | 40.7 | 48.4 | 54.8 | 70.6 | 85.7 | 104.1 | 126.4 | 153.5 |
| Accounts Payable, % | 7.74 | 7.64 | 5.36 | 6.1 | 6.24 | 6.62 | 6.62 | 6.62 | 6.62 | 6.62 |
| Capital Expenditure | -8.8 | -15.7 | -14.0 | -16.6 | -16.3 | -22.2 | -26.9 | -32.7 | -39.7 | -48.2 |
| Capital Expenditure, % | -2.11 | -2.5 | -1.84 | -2.09 | -1.85 | -2.08 | -2.08 | -2.08 | -2.08 | -2.08 |
| Tax Rate, % | 24.13 | 24.13 | 24.13 | 24.13 | 24.13 | 24.13 | 24.13 | 24.13 | 24.13 | 24.13 |
| EBITAT | 41.8 | 70.2 | 106.6 | 111.7 | 136.9 | 138.7 | 168.5 | 204.6 | 248.5 | 301.9 |
| Depreciation | ||||||||||
| Changes in Account Receivables | ||||||||||
| Changes in Inventories | ||||||||||
| Changes in Accounts Payable | ||||||||||
| Capital Expenditure | ||||||||||
| UFCF | -106.4 | 28.2 | 109.6 | 131.4 | 110.8 | 103.0 | 129.5 | 157.2 | 191.0 | 231.9 |
| WACC, % | 8.06 | 8.06 | 8.06 | 8.06 | 8.06 | 8.06 | 8.06 | 8.06 | 8.06 | 8.06 |
| PV UFCF | ||||||||||
| SUM PV UFCF | 628.2 | |||||||||
| Long Term Growth Rate, % | 2.00 | |||||||||
| Free cash flow (T + 1) | 237 | |||||||||
| Terminal Value | 3,904 | |||||||||
| Present Terminal Value | 2,649 | |||||||||
| Enterprise Value | 3,278 | |||||||||
| Net Debt | -156 | |||||||||
| Equity Value | 3,434 | |||||||||
| Diluted Shares Outstanding, MM | 16 | |||||||||
| Equity Value Per Share | 210.49 |
What You Will Get
- Genuine CSW Industrials Data: Preloaded financials – from revenue to EBIT – based on actual and projected figures.
- Complete Customization: Modify all essential parameters (yellow cells) such as WACC, growth %, and tax rates.
- Immediate Valuation Updates: Automatic recalculations to assess the impact of changes on CSW Industrials’ fair value.
- Flexible Excel Template: Designed for quick modifications, scenario testing, and comprehensive projections.
- Efficient and Precise: Avoid building models from the ground up while ensuring accuracy and adaptability.
Key Features
- Accurate CSW Industrials Financials: Access reliable pre-loaded historical data and future projections for CSWI.
- Customizable Forecast Assumptions: Modify yellow-highlighted cells, including WACC, growth rates, and margins tailored for CSWI.
- Dynamic Calculations: Automatic updates to DCF, Net Present Value (NPV), and cash flow analysis specific to CSWI.
- Visual Dashboard: User-friendly charts and summaries to effectively visualize your valuation results for CSWI.
- For Professionals and Beginners: An intuitive layout designed for investors, CFOs, and consultants in the CSWI space.
How It Works
- Step 1: Download the prebuilt Excel template featuring CSW Industrials, Inc. (CSWI) data.
- Step 2: Review the pre-filled sheets to familiarize yourself with the key metrics.
- Step 3: Modify forecasts and assumptions in the editable yellow cells (WACC, growth, margins).
- Step 4: Instantly access recalculated results, including CSW Industrials, Inc.'s (CSWI) intrinsic value.
- Step 5: Make well-informed investment decisions or create reports based on the outputs.
Why Choose This Calculator for CSW Industrials, Inc. (CSWI)?
- User-Friendly Interface: Perfectly crafted for both novices and seasoned professionals.
- Customizable Parameters: Adjust inputs effortlessly to suit your financial analysis.
- Real-Time Feedback: Observe immediate updates to CSW Industrials’ valuation as you tweak your inputs.
- Preloaded Data: Comes equipped with CSW Industrials’ actual financial figures for swift evaluations.
- Endorsed by Experts: A go-to tool for investors and analysts aiming for informed decision-making.
Who Should Use This Product?
- Engineering Students: Explore industry-specific applications and case studies using real-world data.
- Researchers: Integrate advanced models into academic projects or technical papers.
- Investors: Validate your investment strategies and evaluate performance metrics for CSW Industrials, Inc. (CSWI).
- Market Analysts: Enhance your analysis with a customizable financial model tailored for industrial sectors.
- Manufacturing Executives: Understand how leading firms like CSW Industrials, Inc. (CSWI) are assessed in the market.
What the Template Contains
- Pre-Filled Data: Includes CSW Industrials' historical financials and forecasts.
- Discounted Cash Flow Model: Editable DCF valuation model with automatic calculations.
- Weighted Average Cost of Capital (WACC): A dedicated sheet for calculating WACC based on custom inputs.
- Key Financial Ratios: Analyze CSW Industrials' profitability, efficiency, and leverage.
- Customizable Inputs: Edit revenue growth, margins, and tax rates with ease.
- Clear Dashboard: Charts and tables summarizing key valuation results.
Disclaimer
All information, articles, and product details provided on this website are for general informational and educational purposes only. We do not claim any ownership over, nor do we intend to infringe upon, any trademarks, copyrights, logos, brand names, or other intellectual property mentioned or depicted on this site. Such intellectual property remains the property of its respective owners, and any references here are made solely for identification or informational purposes, without implying any affiliation, endorsement, or partnership.
We make no representations or warranties, express or implied, regarding the accuracy, completeness, or suitability of any content or products presented. Nothing on this website should be construed as legal, tax, investment, financial, medical, or other professional advice. In addition, no part of this site—including articles or product references—constitutes a solicitation, recommendation, endorsement, advertisement, or offer to buy or sell any securities, franchises, or other financial instruments, particularly in jurisdictions where such activity would be unlawful.
All content is of a general nature and may not address the specific circumstances of any individual or entity. It is not a substitute for professional advice or services. Any actions you take based on the information provided here are strictly at your own risk. You accept full responsibility for any decisions or outcomes arising from your use of this website and agree to release us from any liability in connection with your use of, or reliance upon, the content or products found herein.