
|
Convatec Group PLC (CTEC.L) Évaluation DCF |
Entièrement Modifiable: Adapté À Vos Besoins Dans Excel Ou Sheets
Conception Professionnelle: Modèles Fiables Et Conformes Aux Normes Du Secteur
Pré-Construits Pour Une Utilisation Rapide Et Efficace
Compatible MAC/PC, entièrement débloqué
Aucune Expertise N'Est Requise; Facile À Suivre
ConvaTec Group Plc (CTEC.L) Bundle
Vous cherchez à évaluer la valeur intrinsèque de Convatec Group PLC? Notre calculatrice (CTECL) DCF intègre des données réelles avec des fonctionnalités de personnalisation approfondies, vous permettant d'affiner vos prévisions et d'améliorer vos stratégies d'investissement.
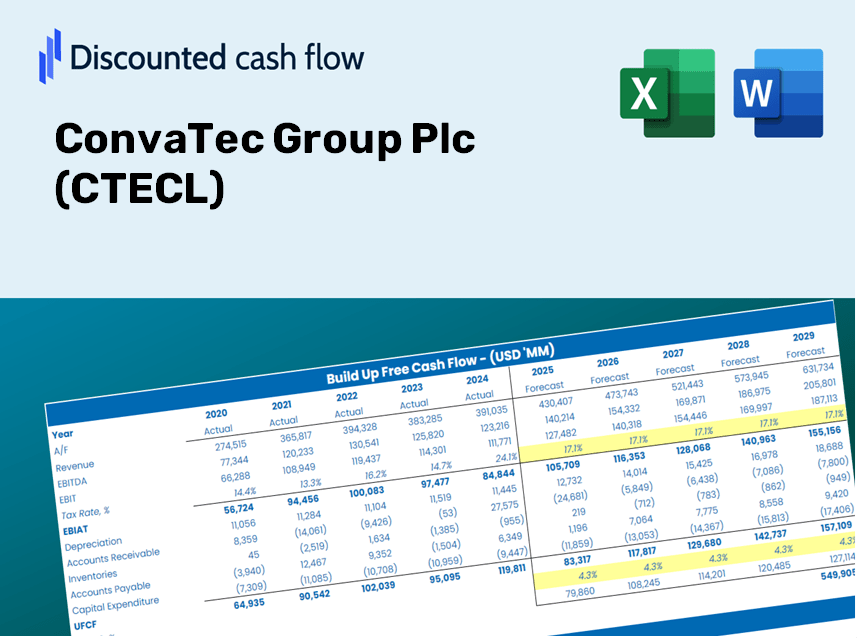
Discounted Cash Flow (DCF) - (USD MM)
| Year | AY1 2020 |
AY2 2021 |
AY3 2022 |
AY4 2023 |
AY5 2024 |
FY1 2025 |
FY2 2026 |
FY3 2027 |
FY4 2028 |
FY5 2029 |
|---|---|---|---|---|---|---|---|---|---|---|
| Revenue | 1,440.3 | 1,549.8 | 1,575.8 | 1,629.0 | 1,740.6 | 1,825.5 | 1,914.5 | 2,007.8 | 2,105.7 | 2,208.4 |
| Revenue Growth, % | 0 | 7.6 | 1.68 | 3.37 | 6.85 | 4.88 | 4.88 | 4.88 | 4.88 | 4.88 |
| EBITDA | 297.1 | 308.2 | 318.7 | 346.3 | 410.7 | 385.5 | 404.3 | 424.0 | 444.7 | 466.4 |
| EBITDA, % | 20.63 | 19.89 | 20.22 | 21.26 | 23.6 | 21.12 | 21.12 | 21.12 | 21.12 | 21.12 |
| Depreciation | 126.1 | 132.4 | 132.3 | 133.4 | 167.9 | 158.9 | 166.6 | 174.8 | 183.3 | 192.2 |
| Depreciation, % | 8.75 | 8.54 | 8.4 | 8.19 | 9.65 | 8.7 | 8.7 | 8.7 | 8.7 | 8.7 |
| EBIT | 171.0 | 175.9 | 186.4 | 213.0 | 242.9 | 226.6 | 237.7 | 249.3 | 261.4 | 274.2 |
| EBIT, % | 11.87 | 11.35 | 11.83 | 13.07 | 13.95 | 12.41 | 12.41 | 12.41 | 12.41 | 12.41 |
| Total Cash | 429.9 | 352.3 | 110.9 | 74.7 | 49.2 | 244.7 | 256.7 | 269.2 | 282.3 | 296.1 |
| Total Cash, percent | .0 | .0 | .0 | .0 | .0 | .0 | .0 | .0 | .0 | .0 |
| Account Receivables | 186.4 | 190.5 | 216.8 | 205.1 | 228.9 | 236.4 | 247.9 | 260.0 | 272.6 | 285.9 |
| Account Receivables, % | 12.94 | 12.29 | 13.76 | 12.59 | 13.15 | 12.95 | 12.95 | 12.95 | 12.95 | 12.95 |
| Inventories | 225.9 | 234.8 | 256.2 | 301.2 | 265.8 | 295.2 | 309.6 | 324.7 | 340.5 | 357.1 |
| Inventories, % | 15.68 | 15.15 | 16.26 | 18.49 | 15.27 | 16.17 | 16.17 | 16.17 | 16.17 | 16.17 |
| Accounts Payable | 74.7 | 88.7 | 85.3 | 104.1 | 95.0 | 102.8 | 107.9 | 113.1 | 118.6 | 124.4 |
| Accounts Payable, % | 5.18 | 5.73 | 5.41 | 6.39 | 5.46 | 5.63 | 5.63 | 5.63 | 5.63 | 5.63 |
| Capital Expenditure | -65.5 | -71.5 | -109.6 | -98.2 | -92.8 | -100.4 | -105.3 | -110.4 | -115.8 | -121.4 |
| Capital Expenditure, % | -4.55 | -4.62 | -6.96 | -6.03 | -5.33 | -5.5 | -5.5 | -5.5 | -5.5 | -5.5 |
| Tax Rate, % | 22.53 | 22.53 | 22.53 | 22.53 | 22.53 | 22.53 | 22.53 | 22.53 | 22.53 | 22.53 |
| EBITAT | 110.1 | 136.7 | 143.1 | 165.8 | 188.1 | 169.6 | 177.9 | 186.6 | 195.7 | 205.2 |
| Depreciation | ||||||||||
| Changes in Account Receivables | ||||||||||
| Changes in Inventories | ||||||||||
| Changes in Accounts Payable | ||||||||||
| Capital Expenditure | ||||||||||
| UFCF | -167.0 | 198.6 | 114.8 | 186.3 | 265.7 | 199.2 | 218.4 | 229.0 | 240.2 | 251.9 |
| WACC, % | 6.75 | 6.87 | 6.87 | 6.87 | 6.87 | 6.85 | 6.85 | 6.85 | 6.85 | 6.85 |
| PV UFCF | ||||||||||
| SUM PV UFCF | 930.7 | |||||||||
| Long Term Growth Rate, % | 3.50 | |||||||||
| Free cash flow (T + 1) | 261 | |||||||||
| Terminal Value | 7,790 | |||||||||
| Present Terminal Value | 5,594 | |||||||||
| Enterprise Value | 6,525 | |||||||||
| Net Debt | 864 | |||||||||
| Equity Value | 5,660 | |||||||||
| Diluted Shares Outstanding, MM | 2,057 | |||||||||
| Equity Value Per Share | 275.21 |
What You'll Receive
- Pre-Populated Financial Model: Utilize ConvaTec Group Plc’s actual data for accurate DCF valuation.
- Comprehensive Forecasting Control: Modify revenue growth, profit margins, WACC, and other critical parameters.
- Real-Time Calculations: Automatic updates allow you to view results instantly as you adjust inputs.
- Professional-Grade Template: A polished Excel file crafted for high-quality valuation tasks.
- Flexible and Reusable: Designed for customization, enabling repeated application for in-depth forecasts.
Key Features
- Comprehensive Financial Data: Gain access to detailed pre-loaded historical financial information and future forecasts for ConvaTec Group Plc (CTECL).
- Adjustable Forecast Parameters: Modify highlighted cells for assumptions such as WACC, growth rates, and profit margins.
- Real-Time Calculations: Enjoy automatic updates for DCF, Net Present Value (NPV), and cash flow assessments.
- User-Friendly Dashboard: Explore clear charts and summaries to effectively visualize your valuation findings.
- Designed for All Skill Levels: An intuitive layout crafted for investors, CFOs, and consultants alike.
How It Works
- 1. Access the Template: Download and open the Excel file containing ConvaTec Group Plc's (CTECL) preloaded data.
- 2. Modify Assumptions: Adjust essential inputs such as growth rates, WACC, and capital expenditures.
- 3. Get Instant Results: The DCF model automatically computes intrinsic value and NPV for you.
- 4. Explore Scenarios: Analyze various forecasts to evaluate different valuation possibilities.
- 5. Make Informed Decisions: Present clear valuation insights to enhance your decision-making process.
Why Choose This Calculator for ConvaTec Group Plc (CTECL)?
- Accurate Data: Utilize real financial metrics from ConvaTec for dependable valuation outcomes.
- Customizable: Modify essential variables such as growth rates, WACC, and tax rates to align with your forecasts.
- Time-Saving: Pre-configured calculations save you the hassle of starting from the ground up.
- Professional-Grade Tool: Tailored for investors, analysts, and consultants focusing on ConvaTec.
- User-Friendly: An intuitive design and clear, step-by-step guidance ensure ease of use for everyone.
Who Should Use This Product?
- Individual Investors: Make informed decisions about buying or selling ConvaTec Group Plc (CTECL) stock.
- Financial Analysts: Streamline valuation processes with ready-to-use financial models specific to ConvaTec Group Plc (CTECL).
- Consultants: Provide precise valuation insights on ConvaTec Group Plc (CTECL) to clients swiftly and accurately.
- Business Owners: Gain insights into how large companies like ConvaTec Group Plc (CTECL) are valued to inform your own business strategy.
- Finance Students: Acquire valuation techniques using real-world data and scenarios related to ConvaTec Group Plc (CTECL).
Overview of the Template Contents
- Preloaded CTECL Data: Historical and projected financial metrics, including revenue, EBIT, and capital expenditures.
- DCF and WACC Models: Advanced sheets designed for calculating intrinsic value and Weighted Average Cost of Capital.
- Editable Inputs: Cells highlighted in yellow for customizing revenue growth, tax rates, and discount rates.
- Financial Statements: Detailed annual and quarterly financial data for thorough analysis.
- Key Ratios: Metrics on profitability, leverage, and efficiency to assess performance.
- Dashboard and Charts: Visual representations of valuation results and underlying assumptions.
Disclaimer
All information, articles, and product details provided on this website are for general informational and educational purposes only. We do not claim any ownership over, nor do we intend to infringe upon, any trademarks, copyrights, logos, brand names, or other intellectual property mentioned or depicted on this site. Such intellectual property remains the property of its respective owners, and any references here are made solely for identification or informational purposes, without implying any affiliation, endorsement, or partnership.
We make no representations or warranties, express or implied, regarding the accuracy, completeness, or suitability of any content or products presented. Nothing on this website should be construed as legal, tax, investment, financial, medical, or other professional advice. In addition, no part of this site—including articles or product references—constitutes a solicitation, recommendation, endorsement, advertisement, or offer to buy or sell any securities, franchises, or other financial instruments, particularly in jurisdictions where such activity would be unlawful.
All content is of a general nature and may not address the specific circumstances of any individual or entity. It is not a substitute for professional advice or services. Any actions you take based on the information provided here are strictly at your own risk. You accept full responsibility for any decisions or outcomes arising from your use of this website and agree to release us from any liability in connection with your use of, or reliance upon, the content or products found herein.