
|
Cytomx Therapeutics, Inc. (CTMX) Évaluation DCF |
Entièrement Modifiable: Adapté À Vos Besoins Dans Excel Ou Sheets
Conception Professionnelle: Modèles Fiables Et Conformes Aux Normes Du Secteur
Pré-Construits Pour Une Utilisation Rapide Et Efficace
Compatible MAC/PC, entièrement débloqué
Aucune Expertise N'Est Requise; Facile À Suivre
CytomX Therapeutics, Inc. (CTMX) Bundle
Découvrez la vraie valeur de Cytomx Therapeutics, Inc. (CTMX) avec notre calculatrice avancée DCF! Ajustez les hypothèses clés, explorez divers scénarios et évaluez comment les changements affectent l'évaluation de Cytomx - le tout dans un seul modèle Excel.
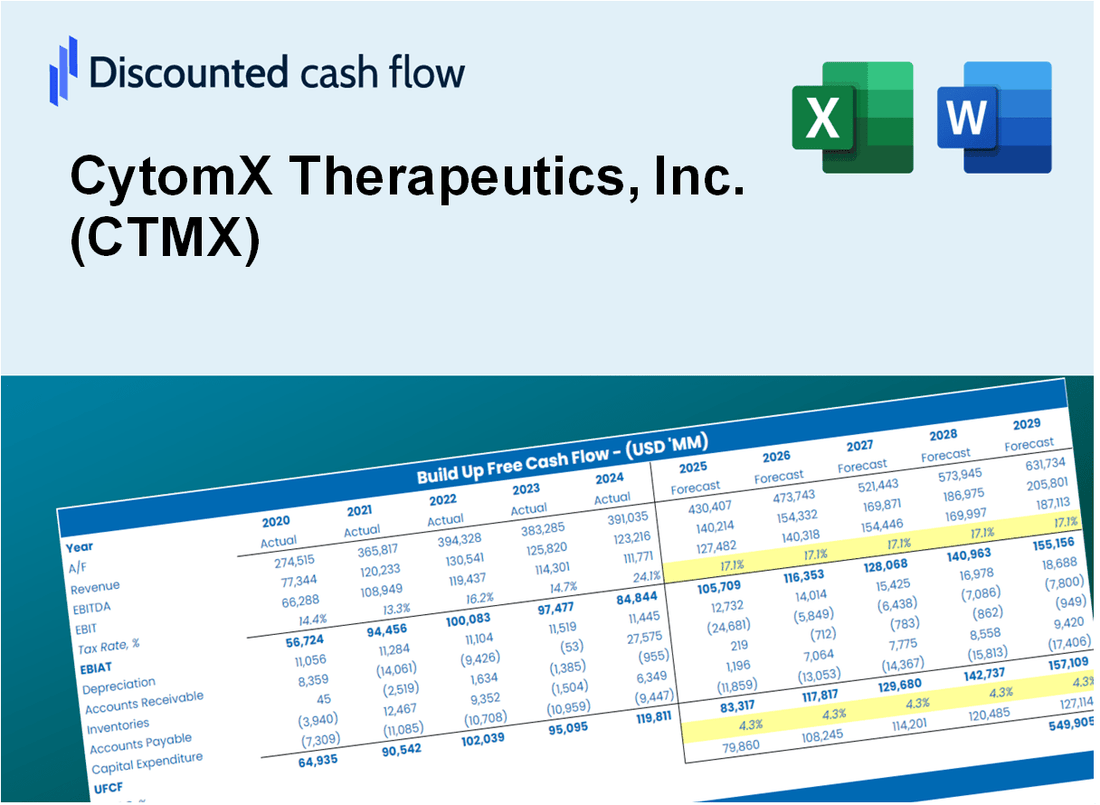
Discounted Cash Flow (DCF) - (USD MM)
| Year | AY1 2020 |
AY2 2021 |
AY3 2022 |
AY4 2023 |
AY5 2024 |
FY1 2025 |
FY2 2026 |
FY3 2027 |
FY4 2028 |
FY5 2029 |
|---|---|---|---|---|---|---|---|---|---|---|
| Revenue | 100.4 | 69.6 | 53.2 | 101.2 | 138.1 | 163.2 | 192.8 | 227.7 | 269.0 | 317.8 |
| Revenue Growth, % | 0 | -30.68 | -23.59 | 90.38 | 36.45 | 18.14 | 18.14 | 18.14 | 18.14 | 18.14 |
| EBITDA | -78.0 | -113.3 | -98.9 | -4.3 | 26.8 | -85.7 | -101.2 | -119.6 | -141.3 | -166.9 |
| EBITDA, % | -77.69 | -162.9 | -186.02 | -4.26 | 19.38 | -52.51 | -52.51 | -52.51 | -52.51 | -52.51 |
| Depreciation | 5.5 | 5.8 | 5.9 | 2.2 | 1.8 | 9.2 | 10.9 | 12.9 | 15.2 | 18.0 |
| Depreciation, % | 5.44 | 8.39 | 11.02 | 2.15 | 1.28 | 5.66 | 5.66 | 5.66 | 5.66 | 5.66 |
| EBIT | -83.4 | -119.2 | -104.7 | -6.5 | 25.0 | -88.6 | -104.6 | -123.6 | -146.1 | -172.5 |
| EBIT, % | -83.13 | -171.29 | -197.03 | -6.41 | 18.1 | -54.29 | -54.29 | -54.29 | -54.29 | -54.29 |
| Total Cash | 316.1 | 305.2 | 193.7 | 174.5 | 100.6 | 154.3 | 182.3 | 215.4 | 254.4 | 300.6 |
| Total Cash, percent | .0 | .0 | .0 | .0 | .0 | .0 | .0 | .0 | .0 | .0 |
| Account Receivables | .8 | .8 | 36.0 | 3.4 | 3.1 | 24.6 | 29.0 | 34.3 | 40.5 | 47.8 |
| Account Receivables, % | 0.79512 | 1.14 | 67.69 | 3.39 | 2.25 | 15.05 | 15.05 | 15.05 | 15.05 | 15.05 |
| Inventories | .0 | .0 | .0 | .0 | .0 | .0 | .0 | .0 | .0 | .0 |
| Inventories, % | 0 | 0 | 0 | 0 | 0 | 0 | 0 | 0 | 0 | 0 |
| Accounts Payable | 3.0 | 2.8 | 2.8 | 1.5 | 1.1 | 4.7 | 5.6 | 6.6 | 7.8 | 9.2 |
| Accounts Payable, % | 2.99 | 4.05 | 5.28 | 1.44 | 0.78782 | 2.91 | 2.91 | 2.91 | 2.91 | 2.91 |
| Capital Expenditure | -2.3 | -1.6 | -1.7 | -.8 | -.3 | -2.9 | -3.4 | -4.1 | -4.8 | -5.7 |
| Capital Expenditure, % | -2.3 | -2.31 | -3.27 | -0.82992 | -0.22447 | -1.79 | -1.79 | -1.79 | -1.79 | -1.79 |
| Tax Rate, % | 0.69797 | 0.69797 | 0.69797 | 0.69797 | 0.69797 | 0.69797 | 0.69797 | 0.69797 | 0.69797 | 0.69797 |
| EBITAT | -58.6 | -115.0 | -102.6 | 1.1 | 24.8 | -64.5 | -76.2 | -90.0 | -106.3 | -125.6 |
| Depreciation | ||||||||||
| Changes in Account Receivables | ||||||||||
| Changes in Inventories | ||||||||||
| Changes in Accounts Payable | ||||||||||
| Capital Expenditure | ||||||||||
| UFCF | -53.3 | -110.9 | -133.7 | 33.6 | 26.2 | -76.0 | -72.3 | -85.4 | -100.9 | -119.2 |
| WACC, % | 14.03 | 14.06 | 14.07 | 13.95 | 14.07 | 14.04 | 14.04 | 14.04 | 14.04 | 14.04 |
| PV UFCF | ||||||||||
| SUM PV UFCF | -301.4 | |||||||||
| Long Term Growth Rate, % | 2.00 | |||||||||
| Free cash flow (T + 1) | -122 | |||||||||
| Terminal Value | -1,011 | |||||||||
| Present Terminal Value | -524 | |||||||||
| Enterprise Value | -825 | |||||||||
| Net Debt | -29 | |||||||||
| Equity Value | -797 | |||||||||
| Diluted Shares Outstanding, MM | 85 | |||||||||
| Equity Value Per Share | -9.40 |
What You Will Get
- Pre-Filled Financial Model: CytomX Therapeutics’ actual data enables precise DCF valuation.
- Full Forecast Control: Adjust revenue growth, margins, WACC, and other key drivers specific to (CTMX).
- Instant Calculations: Automatic updates ensure you see results as you make changes to your projections.
- Investor-Ready Template: A refined Excel file designed for professional-grade valuation of (CTMX).
- Customizable and Reusable: Tailored for flexibility, allowing repeated use for detailed forecasts of (CTMX).
Key Features
- Customizable Clinical Parameters: Adjust essential inputs such as patient enrollment rates, trial durations, and treatment costs.
- Instant Valuation Insights: Generates intrinsic value, net present value (NPV), and additional metrics on demand.
- High-Precision Forecasting: Utilizes CytomX’s actual clinical data for accurate valuation projections.
- Simplified Scenario Testing: Easily evaluate various hypotheses and analyze results side by side.
- Efficiency Booster: Remove the hassle of constructing intricate valuation models from the ground up.
How It Works
- Step 1: Download the Excel file.
- Step 2: Review pre-entered CytomX Therapeutics data (historical and projected).
- Step 3: Adjust key assumptions (yellow cells) based on your analysis.
- Step 4: View automatic recalculations for CytomX Therapeutics' intrinsic value.
- Step 5: Use the outputs for investment decisions or reporting.
Why Choose CytomX Therapeutics, Inc. (CTMX) Calculator?
- All-in-One Solution: Combines DCF, WACC, and financial ratio evaluations tailored for CytomX Therapeutics.
- Flexible Inputs: Modify the highlighted fields to explore different financial scenarios.
- In-Depth Analysis: Automatically computes CytomX’s intrinsic value and Net Present Value.
- Integrated Data: Historical and projected figures provide a solid foundation for analysis.
- Expert-Level Tool: Perfect for financial analysts, investors, and industry consultants focused on biotechnology.
Who Should Use CytomX Therapeutics, Inc. (CTMX)?
- Investors: Gain insights into innovative cancer therapies with a focus on targeted treatments.
- Healthcare Analysts: Utilize comprehensive data to evaluate the potential of pipeline products.
- Consultants: Tailor research findings for client briefings or strategic planning sessions.
- Biotech Enthusiasts: Expand your knowledge of therapeutic development through case studies and real-world applications.
- Educators and Students: Leverage it as a resource for learning about biotech advancements in academic settings.
What the Template Contains
- Preloaded CTMX Data: Historical and projected financial data, including revenue, EBIT, and capital expenditures.
- DCF and WACC Models: Professional-grade sheets for calculating intrinsic value and Weighted Average Cost of Capital.
- Editable Inputs: Yellow-highlighted cells for adjusting revenue growth, tax rates, and discount rates.
- Financial Statements: Comprehensive annual and quarterly financials for deeper analysis.
- Key Ratios: Profitability, leverage, and efficiency ratios to evaluate performance.
- Dashboard and Charts: Visual summaries of valuation outcomes and assumptions.
Disclaimer
All information, articles, and product details provided on this website are for general informational and educational purposes only. We do not claim any ownership over, nor do we intend to infringe upon, any trademarks, copyrights, logos, brand names, or other intellectual property mentioned or depicted on this site. Such intellectual property remains the property of its respective owners, and any references here are made solely for identification or informational purposes, without implying any affiliation, endorsement, or partnership.
We make no representations or warranties, express or implied, regarding the accuracy, completeness, or suitability of any content or products presented. Nothing on this website should be construed as legal, tax, investment, financial, medical, or other professional advice. In addition, no part of this site—including articles or product references—constitutes a solicitation, recommendation, endorsement, advertisement, or offer to buy or sell any securities, franchises, or other financial instruments, particularly in jurisdictions where such activity would be unlawful.
All content is of a general nature and may not address the specific circumstances of any individual or entity. It is not a substitute for professional advice or services. Any actions you take based on the information provided here are strictly at your own risk. You accept full responsibility for any decisions or outcomes arising from your use of this website and agree to release us from any liability in connection with your use of, or reliance upon, the content or products found herein.