
|
CTS Corporation (CTS) Évaluation DCF |
Entièrement Modifiable: Adapté À Vos Besoins Dans Excel Ou Sheets
Conception Professionnelle: Modèles Fiables Et Conformes Aux Normes Du Secteur
Pré-Construits Pour Une Utilisation Rapide Et Efficace
Compatible MAC/PC, entièrement débloqué
Aucune Expertise N'Est Requise; Facile À Suivre
CTS Corporation (CTS) Bundle
Gardez un aperçu de votre analyse d'évaluation CTS Corporation (CTS) avec notre calculatrice sophistiquée DCF! Préchargé avec des données CTS réelles, ce modèle Excel vous permet d'ajuster les prévisions et les hypothèses pour calculer avec précision la valeur intrinsèque de CTS Corporation.
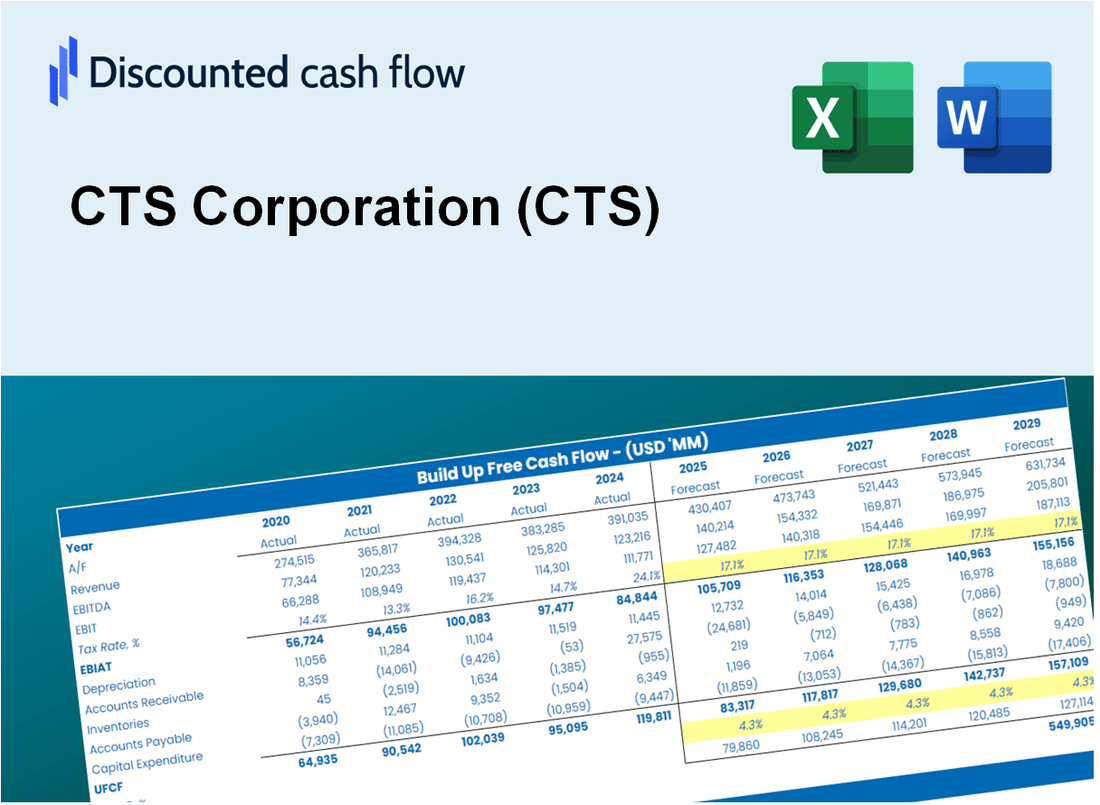
Discounted Cash Flow (DCF) - (USD MM)
| Year | AY1 2020 |
AY2 2021 |
AY3 2022 |
AY4 2023 |
AY5 2024 |
FY1 2025 |
FY2 2026 |
FY3 2027 |
FY4 2028 |
FY5 2029 |
|---|---|---|---|---|---|---|---|---|---|---|
| Revenue | 424.2 | 512.9 | 586.9 | 550.6 | 515.5 | 544.9 | 575.9 | 608.8 | 643.4 | 680.1 |
| Revenue Growth, % | 0 | 20.92 | 14.42 | -6.19 | -6.36 | 5.7 | 5.7 | 5.7 | 5.7 | 5.7 |
| EBITDA | 75.0 | -32.6 | 113.2 | 109.5 | 108.2 | 77.9 | 82.3 | 87.0 | 92.0 | 97.2 |
| EBITDA, % | 17.68 | -6.35 | 19.29 | 19.89 | 20.98 | 14.3 | 14.3 | 14.3 | 14.3 | 14.3 |
| Depreciation | 26.7 | 26.9 | 29.8 | 28.7 | 30.9 | 30.3 | 32.0 | 33.9 | 35.8 | 37.8 |
| Depreciation, % | 6.29 | 5.25 | 5.07 | 5.21 | 6 | 5.56 | 5.56 | 5.56 | 5.56 | 5.56 |
| EBIT | 48.3 | -59.5 | 83.5 | 80.8 | 77.2 | 47.6 | 50.3 | 53.2 | 56.2 | 59.4 |
| EBIT, % | 11.39 | -11.6 | 14.22 | 14.67 | 14.98 | 8.73 | 8.73 | 8.73 | 8.73 | 8.73 |
| Total Cash | 91.8 | 141.5 | 156.9 | 163.9 | 94.3 | 135.2 | 142.9 | 151.0 | 159.6 | 168.7 |
| Total Cash, percent | .0 | .0 | .0 | .0 | .0 | .0 | .0 | .0 | .0 | .0 |
| Account Receivables | 81.0 | 82.2 | 90.9 | 78.6 | 77.6 | 87.1 | 92.1 | 97.3 | 102.9 | 108.7 |
| Account Receivables, % | 19.09 | 16.02 | 15.49 | 14.27 | 15.06 | 15.99 | 15.99 | 15.99 | 15.99 | 15.99 |
| Inventories | 45.9 | 49.5 | 62.3 | 60.0 | 53.6 | 57.1 | 60.3 | 63.8 | 67.4 | 71.2 |
| Inventories, % | 10.81 | 9.65 | 10.61 | 10.9 | 10.39 | 10.47 | 10.47 | 10.47 | 10.47 | 10.47 |
| Accounts Payable | 50.5 | 55.5 | 53.2 | 43.5 | 42.6 | 52.3 | 55.3 | 58.4 | 61.7 | 65.2 |
| Accounts Payable, % | 11.9 | 10.83 | 9.07 | 7.9 | 8.27 | 9.59 | 9.59 | 9.59 | 9.59 | 9.59 |
| Capital Expenditure | -14.9 | -15.6 | -14.3 | -14.7 | -18.6 | -16.7 | -17.6 | -18.6 | -19.7 | -20.8 |
| Capital Expenditure, % | -3.5 | -3.05 | -2.44 | -2.68 | -3.62 | -3.06 | -3.06 | -3.06 | -3.06 | -3.06 |
| Tax Rate, % | 18.41 | 18.41 | 18.41 | 18.41 | 18.41 | 18.41 | 18.41 | 18.41 | 18.41 | 18.41 |
| EBITAT | 36.9 | -40.9 | 61.6 | 65.1 | 63.0 | 36.3 | 38.3 | 40.5 | 42.8 | 45.3 |
| Depreciation | ||||||||||
| Changes in Account Receivables | ||||||||||
| Changes in Inventories | ||||||||||
| Changes in Accounts Payable | ||||||||||
| Capital Expenditure | ||||||||||
| UFCF | -27.7 | -29.4 | 53.2 | 83.9 | 81.8 | 46.6 | 47.5 | 50.2 | 53.1 | 56.1 |
| WACC, % | 7.7 | 7.68 | 7.69 | 7.72 | 7.72 | 7.7 | 7.7 | 7.7 | 7.7 | 7.7 |
| PV UFCF | ||||||||||
| SUM PV UFCF | 202.6 | |||||||||
| Long Term Growth Rate, % | 3.00 | |||||||||
| Free cash flow (T + 1) | 58 | |||||||||
| Terminal Value | 1,229 | |||||||||
| Present Terminal Value | 848 | |||||||||
| Enterprise Value | 1,051 | |||||||||
| Net Debt | 23 | |||||||||
| Equity Value | 1,028 | |||||||||
| Diluted Shares Outstanding, MM | 31 | |||||||||
| Equity Value Per Share | 33.47 |
What You Will Receive
- Pre-Filled Financial Model: CTS Corporation’s actual data facilitates accurate DCF valuation.
- Comprehensive Forecast Control: Modify revenue growth, margins, WACC, and other essential factors.
- Real-Time Calculations: Automatic updates provide immediate results as adjustments are made.
- Investor-Ready Template: A polished Excel file crafted for high-quality valuation.
- Customizable and Reusable: Designed for versatility, allowing repeated application for in-depth forecasts.
Key Features
- Comprehensive Financial Data: Gain access to precise historical figures and future forecasts for CTS Corporation (CTS).
- Adjustable Projection Inputs: Modify highlighted fields such as WACC, growth rates, and profit margins.
- Real-Time Calculations: Instantaneous updates for DCF, Net Present Value (NPV), and cash flow evaluations.
- User-Friendly Dashboard: Intuitive charts and summaries to help you interpret your valuation insights.
- Designed for All Levels: A straightforward layout tailored for investors, CFOs, and consultants alike.
How It Works
- Step 1: Download the prebuilt Excel template featuring CTS Corporation’s data.
- Step 2: Navigate through the pre-filled sheets to grasp the essential metrics.
- Step 3: Modify forecasts and assumptions in the editable yellow cells (WACC, growth, margins).
- Step 4: Instantly see recalculated results, including CTS Corporation’s intrinsic value.
- Step 5: Make informed investment choices or create reports based on the outputs.
Why Choose the CTS Corporation (CTS) Calculator?
- Accuracy: Utilizes real CTS financial data to ensure precision.
- Flexibility: Allows users to easily test and adjust inputs as needed.
- Time-Saving: Eliminate the need to create a DCF model from the ground up.
- Professional-Grade: Crafted with the expertise and usability expected at the CFO level.
- User-Friendly: Intuitive design makes it accessible for users without extensive financial modeling skills.
Who Should Use CTS Corporation (CTS)?
- Investors: Gain insights into the market with CTS's innovative products and services.
- Financial Analysts: Utilize comprehensive data to enhance your analysis of CTS's performance.
- Consultants: Leverage CTS's offerings to create tailored solutions for your clients.
- Industry Enthusiasts: Explore advanced technologies and trends driven by CTS's initiatives.
- Educators and Students: Incorporate CTS case studies into finance and engineering curricula.
What the CTS Template Contains
- Pre-Filled Data: Includes CTS Corporation’s historical financials and forecasts.
- Discounted Cash Flow Model: Editable DCF valuation model with automatic calculations.
- Weighted Average Cost of Capital (WACC): A dedicated sheet for calculating WACC based on custom inputs.
- Key Financial Ratios: Analyze CTS Corporation’s profitability, efficiency, and leverage.
- Customizable Inputs: Edit revenue growth, margins, and tax rates with ease.
- Clear Dashboard: Charts and tables summarizing key valuation results.
Disclaimer
All information, articles, and product details provided on this website are for general informational and educational purposes only. We do not claim any ownership over, nor do we intend to infringe upon, any trademarks, copyrights, logos, brand names, or other intellectual property mentioned or depicted on this site. Such intellectual property remains the property of its respective owners, and any references here are made solely for identification or informational purposes, without implying any affiliation, endorsement, or partnership.
We make no representations or warranties, express or implied, regarding the accuracy, completeness, or suitability of any content or products presented. Nothing on this website should be construed as legal, tax, investment, financial, medical, or other professional advice. In addition, no part of this site—including articles or product references—constitutes a solicitation, recommendation, endorsement, advertisement, or offer to buy or sell any securities, franchises, or other financial instruments, particularly in jurisdictions where such activity would be unlawful.
All content is of a general nature and may not address the specific circumstances of any individual or entity. It is not a substitute for professional advice or services. Any actions you take based on the information provided here are strictly at your own risk. You accept full responsibility for any decisions or outcomes arising from your use of this website and agree to release us from any liability in connection with your use of, or reliance upon, the content or products found herein.