|
CIVEO CORPORATION (CVEO) Évaluation DCF |
Entièrement Modifiable: Adapté À Vos Besoins Dans Excel Ou Sheets
Conception Professionnelle: Modèles Fiables Et Conformes Aux Normes Du Secteur
Pré-Construits Pour Une Utilisation Rapide Et Efficace
Compatible MAC/PC, entièrement débloqué
Aucune Expertise N'Est Requise; Facile À Suivre
Civeo Corporation (CVEO) Bundle
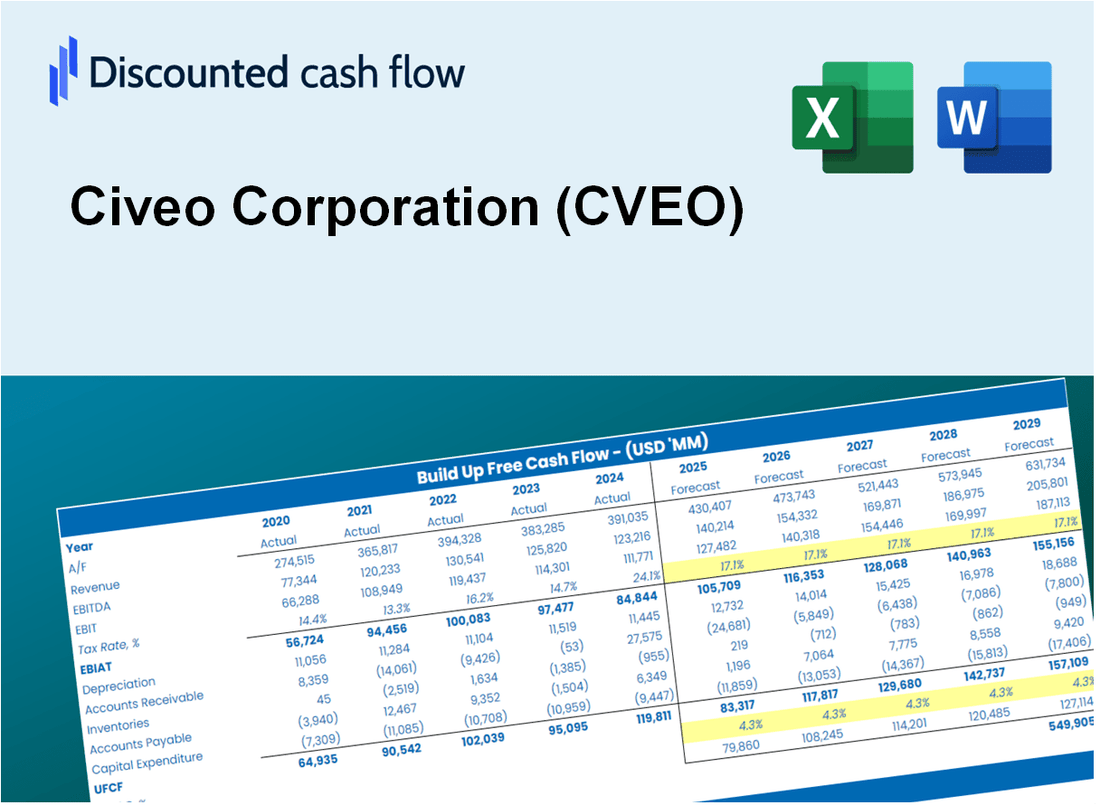
Simplifier la valorisation de Civeo Corporation (CVEO) avec cette calculatrice DCF personnalisable! Doté de la véritable valeur financière de Civeo Corporation (CVEO) et de prévisions ajustées, vous pouvez tester les scénarios et découvrir la juste valeur de Civeo Corporation (CVEO) en minutes.
What You Will Get
- Editable Forecast Inputs: Easily modify assumptions (growth %, margins, WACC) to explore various scenarios.
- Real-World Data: Civeo Corporation’s (CVEO) financial data pre-filled to facilitate your analysis.
- Automatic DCF Outputs: The template computes Net Present Value (NPV) and intrinsic value automatically.
- Customizable and Professional: A refined Excel model tailored to meet your valuation requirements.
- Built for Analysts and Investors: Perfect for evaluating projections, confirming strategies, and enhancing efficiency.
Key Features
- Comprehensive Financial Data: Civeo Corporation’s historical financial statements and pre-filled projections.
- Customizable Parameters: Adjust WACC, tax rates, revenue growth, and EBITDA margins as needed.
- Real-Time Insights: Monitor Civeo’s intrinsic value recalculating instantly.
- Intuitive Visualizations: Dashboard charts illustrate valuation outcomes and essential metrics.
- Designed for Precision: A professional-grade tool for analysts, investors, and finance professionals.
How It Works
- Step 1: Download the Excel file.
- Step 2: Review Civeo Corporation’s pre-filled financial data and forecasts.
- Step 3: Modify critical inputs like revenue growth, WACC, and tax rates (highlighted cells).
- Step 4: Watch the DCF model update instantly as you tweak assumptions.
- Step 5: Analyze the outputs and use the results for investment decisions regarding Civeo Corporation (CVEO).
Why Choose This Calculator for Civeo Corporation (CVEO)?
- Accurate Data: Utilize real Civeo Corporation financials for trustworthy valuation outcomes.
- Customizable: Modify essential parameters such as growth rates, WACC, and tax rates to align with your forecasts.
- Time-Saving: Built-in calculations save you the hassle of starting from the ground up.
- Professional-Grade Tool: Tailored for investors, analysts, and consultants in the industry.
- User-Friendly: Easy-to-navigate design and clear instructions make it accessible for all users.
Who Should Use This Product?
- Investors: Evaluate Civeo Corporation's (CVEO) valuation before making investment decisions.
- CFOs and Financial Analysts: Optimize valuation methodologies and assess financial forecasts.
- Startup Founders: Understand the valuation strategies of established companies like Civeo Corporation.
- Consultants: Provide clients with comprehensive valuation analyses and reports.
- Students and Educators: Utilize current market data to learn and teach valuation principles.
What the Template Contains
- Comprehensive DCF Model: Editable template with detailed valuation calculations tailored for Civeo Corporation (CVEO).
- Real-World Data: Civeo's historical and projected financials preloaded for thorough analysis.
- Customizable Parameters: Adjust WACC, growth rates, and tax assumptions to explore various scenarios.
- Financial Statements: Complete annual and quarterly breakdowns for enhanced insights into Civeo's performance.
- Key Ratios: Integrated analysis for profitability, efficiency, and leverage specific to Civeo Corporation (CVEO).
- Dashboard with Visual Outputs: Charts and tables providing clear, actionable results for informed decision-making.
Disclaimer
All information, articles, and product details provided on this website are for general informational and educational purposes only. We do not claim any ownership over, nor do we intend to infringe upon, any trademarks, copyrights, logos, brand names, or other intellectual property mentioned or depicted on this site. Such intellectual property remains the property of its respective owners, and any references here are made solely for identification or informational purposes, without implying any affiliation, endorsement, or partnership.
We make no representations or warranties, express or implied, regarding the accuracy, completeness, or suitability of any content or products presented. Nothing on this website should be construed as legal, tax, investment, financial, medical, or other professional advice. In addition, no part of this site—including articles or product references—constitutes a solicitation, recommendation, endorsement, advertisement, or offer to buy or sell any securities, franchises, or other financial instruments, particularly in jurisdictions where such activity would be unlawful.
All content is of a general nature and may not address the specific circumstances of any individual or entity. It is not a substitute for professional advice or services. Any actions you take based on the information provided here are strictly at your own risk. You accept full responsibility for any decisions or outcomes arising from your use of this website and agree to release us from any liability in connection with your use of, or reliance upon, the content or products found herein.