
|
CRANSWICK PLC (CWK.L) Évaluation DCF |
Entièrement Modifiable: Adapté À Vos Besoins Dans Excel Ou Sheets
Conception Professionnelle: Modèles Fiables Et Conformes Aux Normes Du Secteur
Pré-Construits Pour Une Utilisation Rapide Et Efficace
Compatible MAC/PC, entièrement débloqué
Aucune Expertise N'Est Requise; Facile À Suivre
Cranswick plc (CWK.L) Bundle
Explorez les perspectives financières de Cranswick plc (CWKL) avec notre calculatrice DCF conviviale! Entrez vos projections pour la croissance, les marges et les dépenses pour calculer la valeur intrinsèque de Cranswick plc (CWKL) et améliorer votre approche d'investissement.
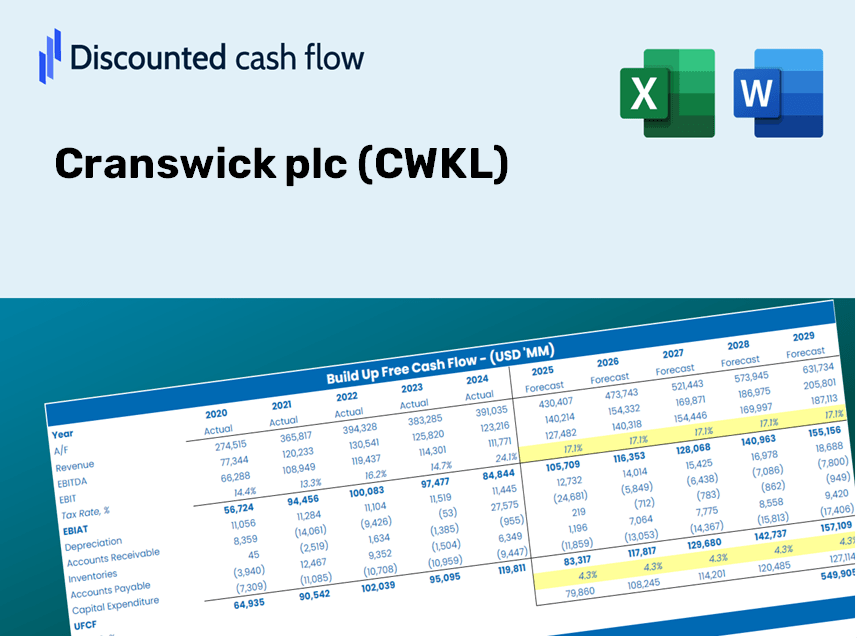
Discounted Cash Flow (DCF) - (USD MM)
| Year | AY1 2021 |
AY2 2022 |
AY3 2023 |
AY4 2024 |
AY5 2025 |
FY1 2026 |
FY2 2027 |
FY3 2028 |
FY4 2029 |
FY5 2030 |
|---|---|---|---|---|---|---|---|---|---|---|
| Revenue | 1,898.4 | 2,008.5 | 2,323.0 | 2,599.3 | 2,723.3 | 2,982.8 | 3,267.1 | 3,578.5 | 3,919.6 | 4,293.1 |
| Revenue Growth, % | 0 | 5.8 | 15.66 | 11.89 | 4.77 | 9.53 | 9.53 | 9.53 | 9.53 | 9.53 |
| EBITDA | 185.5 | 199.0 | 220.0 | 253.6 | 280.7 | 293.6 | 321.6 | 352.2 | 385.8 | 422.6 |
| EBITDA, % | 9.77 | 9.91 | 9.47 | 9.76 | 10.31 | 9.84 | 9.84 | 9.84 | 9.84 | 9.84 |
| Depreciation | 67.7 | 65.3 | 74.0 | 86.7 | 89.9 | 99.3 | 108.7 | 119.1 | 130.4 | 142.9 |
| Depreciation, % | 3.57 | 3.25 | 3.19 | 3.34 | 3.3 | 3.33 | 3.33 | 3.33 | 3.33 | 3.33 |
| EBIT | 117.8 | 133.7 | 146.0 | 166.9 | 190.8 | 194.3 | 212.8 | 233.1 | 255.4 | 279.7 |
| EBIT, % | 6.21 | 6.66 | 6.28 | 6.42 | 7.01 | 6.51 | 6.51 | 6.51 | 6.51 | 6.51 |
| Total Cash | 39.9 | .2 | 20.4 | 27.0 | 5.9 | 25.3 | 27.7 | 30.4 | 33.3 | 36.5 |
| Total Cash, percent | .0 | .0 | .0 | .0 | .0 | .0 | .0 | .0 | .0 | .0 |
| Account Receivables | .0 | .0 | .0 | 310.7 | 340.1 | 145.8 | 159.7 | 174.9 | 191.6 | 209.9 |
| Account Receivables, % | 0 | 0 | 0 | 11.95 | 12.49 | 4.89 | 4.89 | 4.89 | 4.89 | 4.89 |
| Inventories | 122.9 | 155.9 | 185.8 | 197.4 | 218.7 | 225.9 | 247.4 | 271.0 | 296.8 | 325.1 |
| Inventories, % | 6.47 | 7.76 | 8 | 7.59 | 8.03 | 7.57 | 7.57 | 7.57 | 7.57 | 7.57 |
| Accounts Payable | 131.4 | 147.4 | 167.6 | 180.0 | 191.4 | 211.4 | 231.5 | 253.6 | 277.7 | 304.2 |
| Accounts Payable, % | 6.92 | 7.34 | 7.21 | 6.92 | 7.03 | 7.09 | 7.09 | 7.09 | 7.09 | 7.09 |
| Capital Expenditure | -71.9 | -93.7 | -85.1 | -100.5 | -137.6 | -125.5 | -137.4 | -150.5 | -164.9 | -180.6 |
| Capital Expenditure, % | -3.79 | -4.67 | -3.66 | -3.87 | -5.05 | -4.21 | -4.21 | -4.21 | -4.21 | -4.21 |
| Tax Rate, % | 26.05 | 26.05 | 26.05 | 26.05 | 26.05 | 26.05 | 26.05 | 26.05 | 26.05 | 26.05 |
| EBITAT | 94.9 | 106.5 | 116.6 | 119.2 | 141.1 | 149.8 | 164.1 | 179.7 | 196.9 | 215.6 |
| Depreciation | ||||||||||
| Changes in Account Receivables | ||||||||||
| Changes in Inventories | ||||||||||
| Changes in Accounts Payable | ||||||||||
| Capital Expenditure | ||||||||||
| UFCF | 99.2 | 61.1 | 95.8 | -204.5 | 54.1 | 330.7 | 120.1 | 131.5 | 144.1 | 157.8 |
| WACC, % | 6.41 | 6.41 | 6.41 | 6.38 | 6.39 | 6.4 | 6.4 | 6.4 | 6.4 | 6.4 |
| PV UFCF | ||||||||||
| SUM PV UFCF | 754.2 | |||||||||
| Long Term Growth Rate, % | 2.00 | |||||||||
| Free cash flow (T + 1) | 161 | |||||||||
| Terminal Value | 3,659 | |||||||||
| Present Terminal Value | 2,683 | |||||||||
| Enterprise Value | 3,438 | |||||||||
| Net Debt | 172 | |||||||||
| Equity Value | 3,265 | |||||||||
| Diluted Shares Outstanding, MM | 55 | |||||||||
| Equity Value Per Share | 5,987.19 |
What You Will Receive
- Authentic CWKL Financial Data: Access to both historical and projected figures for precise valuation.
- Customizable Inputs: Adjust WACC, tax rates, revenue growth, and capital expenditures as needed.
- Automated Calculations: The intrinsic value and NPV are computed in real-time.
- Scenario Assessment: Evaluate a variety of scenarios to analyze Cranswick's future performance.
- User-Friendly Interface: Designed for professionals but easy for newcomers to navigate.
Key Features
- Real-Life CWKL Data: Pre-filled with Cranswick plc’s historical financials and forward-looking projections.
- Fully Customizable Inputs: Modify revenue growth, profit margins, WACC, tax rates, and capital expenditures to fit your analysis.
- Dynamic Valuation Model: Automatic adjustments to Net Present Value (NPV) and intrinsic value in response to your inputs.
- Scenario Testing: Develop various forecasting scenarios to explore different valuation outcomes.
- User-Friendly Design: Intuitive and organized, catering to both professionals and those new to financial analysis.
How It Functions
- Download: Obtain the preformatted Excel spreadsheet containing Cranswick plc's (CWKL) financial data.
- Customize: Tailor your forecasts, including revenue growth, EBITDA %, and WACC.
- Real-Time Updates: The intrinsic value and NPV calculations refresh automatically.
- Scenario Testing: Generate various projections and instantly compare results.
- Informed Decisions: Leverage the valuation outcomes to shape your investment strategy.
Why Opt for This Calculator?
- Reliable Data: Authentic Cranswick plc financials provide dependable valuation outcomes.
- Flexible: Modify essential variables such as growth rates, WACC, and tax rates to fit your forecasts.
- Efficient: Pre-configured calculations save you from starting from the ground up.
- Professional-Quality Tool: Tailored for investors, analysts, and consultants.
- Easy to Use: User-friendly design with clear, step-by-step guidance for all users.
Who Can Benefit from Cranswick plc (CWKL)?
- Investors: Make well-informed decisions with our top-tier valuation tool.
- Financial Analysts: Streamline your workflow with an easily customizable pre-built DCF model.
- Consultants: Effortlessly modify the template for impactful client presentations and reports.
- Finance Enthusiasts: Enhance your knowledge of valuation techniques through practical, real-world examples.
- Educators and Students: Utilize this resource as a hands-on learning aid in finance courses.
Contents of the Template
- Operating and Balance Sheet Data: Pre-filled Cranswick plc (CWKL) historical data and forecasts, including revenue, EBITDA, EBIT, and capital expenditures.
- WACC Calculation: A dedicated sheet for Weighted Average Cost of Capital (WACC), featuring parameters like Beta, risk-free rate, and share price.
- DCF Valuation (Unlevered and Levered): Customizable Discounted Cash Flow models that display intrinsic value along with detailed calculations.
- Financial Statements: Pre-loaded annual and quarterly financial statements to assist with analysis.
- Key Ratios: Offers profitability, leverage, and efficiency ratios specific to Cranswick plc (CWKL).
- Dashboard and Charts: A visual overview of valuation outputs and assumptions, facilitating easy analysis of results.
Disclaimer
All information, articles, and product details provided on this website are for general informational and educational purposes only. We do not claim any ownership over, nor do we intend to infringe upon, any trademarks, copyrights, logos, brand names, or other intellectual property mentioned or depicted on this site. Such intellectual property remains the property of its respective owners, and any references here are made solely for identification or informational purposes, without implying any affiliation, endorsement, or partnership.
We make no representations or warranties, express or implied, regarding the accuracy, completeness, or suitability of any content or products presented. Nothing on this website should be construed as legal, tax, investment, financial, medical, or other professional advice. In addition, no part of this site—including articles or product references—constitutes a solicitation, recommendation, endorsement, advertisement, or offer to buy or sell any securities, franchises, or other financial instruments, particularly in jurisdictions where such activity would be unlawful.
All content is of a general nature and may not address the specific circumstances of any individual or entity. It is not a substitute for professional advice or services. Any actions you take based on the information provided here are strictly at your own risk. You accept full responsibility for any decisions or outcomes arising from your use of this website and agree to release us from any liability in connection with your use of, or reliance upon, the content or products found herein.