
|
Dalmia Bharat Limited (dalbharat.ns) Valation DCF |
Entièrement Modifiable: Adapté À Vos Besoins Dans Excel Ou Sheets
Conception Professionnelle: Modèles Fiables Et Conformes Aux Normes Du Secteur
Pré-Construits Pour Une Utilisation Rapide Et Efficace
Compatible MAC/PC, entièrement débloqué
Aucune Expertise N'Est Requise; Facile À Suivre
Dalmia Bharat Limited (DALBHARAT.NS) Bundle
Explorez le potentiel financier de Dalmia Bharat Limited (Dalbharatns) avec notre calculatrice DCF conviviale! Entrez vos hypothèses concernant la croissance, les marges et les coûts pour calculer la valeur intrinsèque de Dalmia Bharat Limited (Dalbharatns) et améliorez votre stratégie d'investissement.
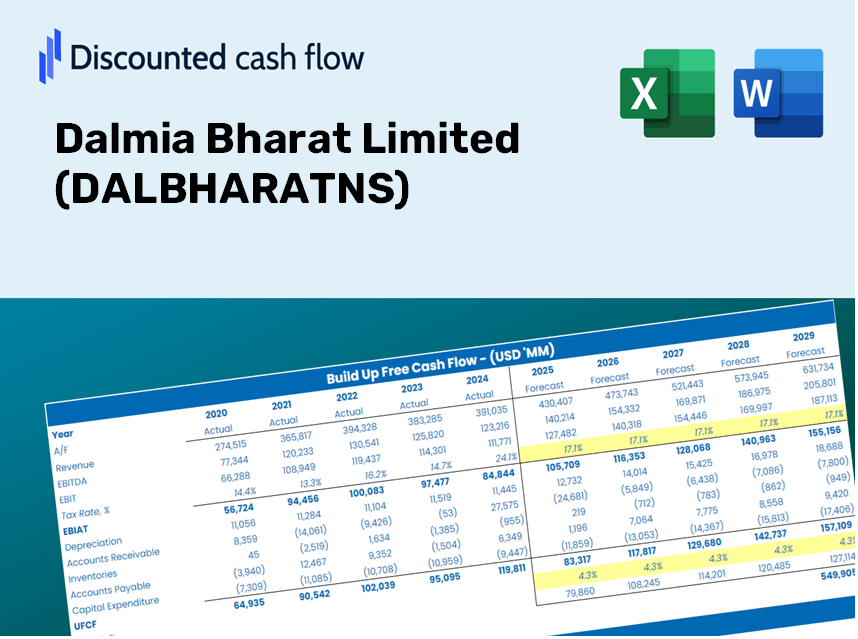
Discounted Cash Flow (DCF) - (USD MM)
| Year | AY1 2021 |
AY2 2022 |
AY3 2023 |
AY4 2024 |
AY5 2025 |
FY1 2026 |
FY2 2027 |
FY3 2028 |
FY4 2029 |
FY5 2030 |
|---|---|---|---|---|---|---|---|---|---|---|
| Revenue | 99,880.0 | 112,860.0 | 133,190.0 | 144,180.0 | 139,800.0 | 152,459.8 | 166,266.0 | 181,322.4 | 197,742.4 | 215,649.2 |
| Revenue Growth, % | 0 | 13 | 18.01 | 8.25 | -3.04 | 9.06 | 9.06 | 9.06 | 9.06 | 9.06 |
| EBITDA | 28,800.0 | 25,680.0 | 22,520.0 | 29,540.0 | 25,470.0 | 32,688.5 | 35,648.7 | 38,876.9 | 42,397.5 | 46,236.8 |
| EBITDA, % | 28.83 | 22.75 | 16.91 | 20.49 | 18.22 | 21.44 | 21.44 | 21.44 | 21.44 | 21.44 |
| Depreciation | 12,500.0 | 12,350.0 | 13,050.0 | 14,980.0 | 13,310.0 | 16,211.5 | 17,679.5 | 19,280.5 | 21,026.5 | 22,930.6 |
| Depreciation, % | 12.52 | 10.94 | 9.8 | 10.39 | 9.52 | 10.63 | 10.63 | 10.63 | 10.63 | 10.63 |
| EBIT | 16,300.0 | 13,330.0 | 9,470.0 | 14,560.0 | 12,160.0 | 16,477.1 | 17,969.2 | 19,596.4 | 21,371.0 | 23,306.3 |
| EBIT, % | 16.32 | 11.81 | 7.11 | 10.1 | 8.7 | 10.81 | 10.81 | 10.81 | 10.81 | 10.81 |
| Total Cash | 35,380.0 | 45,750.0 | 38,790.0 | 44,720.0 | 46,020.0 | 51,537.0 | 56,204.1 | 61,293.7 | 66,844.2 | 72,897.4 |
| Total Cash, percent | .0 | .0 | .0 | .0 | .0 | .0 | .0 | .0 | .0 | .0 |
| Account Receivables | 11,820.0 | 13,110.0 | 7,000.0 | 8,360.0 | 9,010.0 | 12,486.2 | 13,616.9 | 14,850.0 | 16,194.8 | 17,661.3 |
| Account Receivables, % | 11.83 | 11.62 | 5.26 | 5.8 | 6.44 | 8.19 | 8.19 | 8.19 | 8.19 | 8.19 |
| Inventories | 7,600.0 | 9,450.0 | 13,160.0 | 12,180.0 | 13,860.0 | 13,485.0 | 14,706.2 | 16,037.9 | 17,490.3 | 19,074.1 |
| Inventories, % | 7.61 | 8.37 | 9.88 | 8.45 | 9.91 | 8.84 | 8.84 | 8.84 | 8.84 | 8.84 |
| Accounts Payable | 8,990.0 | 8,500.0 | 11,350.0 | 13,160.0 | 15,390.0 | 13,779.3 | 15,027.1 | 16,387.9 | 17,871.9 | 19,490.4 |
| Accounts Payable, % | 9 | 7.53 | 8.52 | 9.13 | 11.01 | 9.04 | 9.04 | 9.04 | 9.04 | 9.04 |
| Capital Expenditure | -10,460.0 | -17,690.0 | -27,090.0 | -28,270.0 | -26,640.0 | -25,963.7 | -28,314.9 | -30,879.0 | -33,675.3 | -36,724.8 |
| Capital Expenditure, % | -10.47 | -15.67 | -20.34 | -19.61 | -19.06 | -17.03 | -17.03 | -17.03 | -17.03 | -17.03 |
| Tax Rate, % | 16.4 | 16.4 | 16.4 | 16.4 | 16.4 | 16.4 | 16.4 | 16.4 | 16.4 | 16.4 |
| EBITAT | 14,003.9 | 9,442.1 | 7,397.3 | 11,239.8 | 10,165.6 | 13,038.5 | 14,219.2 | 15,506.8 | 16,911.1 | 18,442.5 |
| Depreciation | ||||||||||
| Changes in Account Receivables | ||||||||||
| Changes in Inventories | ||||||||||
| Changes in Accounts Payable | ||||||||||
| Capital Expenditure | ||||||||||
| UFCF | 5,613.9 | 472.1 | -1,392.7 | -620.2 | -3,264.4 | -1,425.8 | 2,479.7 | 2,704.3 | 2,949.2 | 3,216.2 |
| WACC, % | 5.24 | 5.11 | 5.17 | 5.16 | 5.22 | 5.18 | 5.18 | 5.18 | 5.18 | 5.18 |
| PV UFCF | ||||||||||
| SUM PV UFCF | 8,118.4 | |||||||||
| Long Term Growth Rate, % | 4.00 | |||||||||
| Free cash flow (T + 1) | 3,345 | |||||||||
| Terminal Value | 283,564 | |||||||||
| Present Terminal Value | 220,290 | |||||||||
| Enterprise Value | 228,408 | |||||||||
| Net Debt | 55,440 | |||||||||
| Equity Value | 172,968 | |||||||||
| Diluted Shares Outstanding, MM | 188 | |||||||||
| Equity Value Per Share | 922.33 |
What You Will Receive
- Authentic DALBHARATNS Financials: Access to historical and projected data for precise valuation.
- Customizable Parameters: Adjust WACC, tax rates, revenue growth, and capital expenditures as needed.
- Instant Calculations: Intrinsic value and NPV are computed in real-time.
- Scenario Analysis: Explore various scenarios to assess Dalmia Bharat’s future performance.
- User-Friendly Interface: Designed for professionals while remaining accessible to newcomers.
Key Features
- Comprehensive DCF Calculator: Offers detailed unlevered and levered DCF valuation frameworks.
- WACC Calculator: Features a pre-constructed Weighted Average Cost of Capital sheet with adjustable parameters.
- Customizable Forecast Assumptions: Easily adjust growth projections, capital expenditures, and discount rates.
- Integrated Financial Ratios: Evaluate profitability, leverage, and efficiency ratios specifically for Dalmia Bharat Limited (DALBHARATNS).
- User-Friendly Dashboard and Charts: Visual representations present essential valuation metrics for straightforward analysis.
How It Works
- Step 1: Download the prebuilt Excel template featuring Dalmia Bharat Limited (DALBHARATNS) data.
- Step 2: Navigate through the pre-filled sheets to familiarize yourself with the key metrics.
- Step 3: Modify forecasts and assumptions in the editable yellow cells (WACC, growth, margins).
- Step 4: Instantly view the recalibrated results, including Dalmia Bharat Limited’s intrinsic value.
- Step 5: Utilize the outputs to make informed investment decisions or generate comprehensive reports.
Why Opt for Dalmia Bharat's Calculator?
- Precision: Utilizes authentic Dalmia Bharat financial data to ensure reliability.
- Adaptability: Tailored for users to easily experiment with and adjust inputs.
- Efficiency: Eliminate the complexity of creating a DCF model from the ground up.
- High-Quality: Engineered with the accuracy and usability expected at the CFO level.
- Intuitive: User-friendly design accessible to individuals without extensive financial modeling skills.
Who Should Use This Product?
- Investors: Evaluate Dalmia Bharat's (DALBHARATNS) valuation prior to making stock trades.
- CFOs and Financial Analysts: Enhance valuation methodologies and assess financial forecasts.
- Startup Founders: Gain insights into the valuation practices of established companies like Dalmia Bharat.
- Consultants: Create detailed valuation reports for your clients using Dalmia Bharat's insights.
- Students and Educators: Apply real-world examples to learn and teach valuation methods effectively.
Contents of the Template
- Pre-Filled Data: Contains Dalmia Bharat Limited's historical financial performance and projections.
- Discounted Cash Flow Model: An editable DCF valuation model featuring automatic calculations.
- Weighted Average Cost of Capital (WACC): A separate sheet for calculating WACC using tailored inputs.
- Key Financial Ratios: Evaluate Dalmia Bharat Limited's profitability, efficiency, and financial leverage.
- Customizable Inputs: Easily modify revenue growth, profit margins, and tax rates.
- Intuitive Dashboard: Visualizations and tables that highlight essential valuation outcomes.
Disclaimer
All information, articles, and product details provided on this website are for general informational and educational purposes only. We do not claim any ownership over, nor do we intend to infringe upon, any trademarks, copyrights, logos, brand names, or other intellectual property mentioned or depicted on this site. Such intellectual property remains the property of its respective owners, and any references here are made solely for identification or informational purposes, without implying any affiliation, endorsement, or partnership.
We make no representations or warranties, express or implied, regarding the accuracy, completeness, or suitability of any content or products presented. Nothing on this website should be construed as legal, tax, investment, financial, medical, or other professional advice. In addition, no part of this site—including articles or product references—constitutes a solicitation, recommendation, endorsement, advertisement, or offer to buy or sell any securities, franchises, or other financial instruments, particularly in jurisdictions where such activity would be unlawful.
All content is of a general nature and may not address the specific circumstances of any individual or entity. It is not a substitute for professional advice or services. Any actions you take based on the information provided here are strictly at your own risk. You accept full responsibility for any decisions or outcomes arising from your use of this website and agree to release us from any liability in connection with your use of, or reliance upon, the content or products found herein.