
|
Modèles de données Limite |
Entièrement Modifiable: Adapté À Vos Besoins Dans Excel Ou Sheets
Conception Professionnelle: Modèles Fiables Et Conformes Aux Normes Du Secteur
Pré-Construits Pour Une Utilisation Rapide Et Efficace
Compatible MAC/PC, entièrement débloqué
Aucune Expertise N'Est Requise; Facile À Suivre
Data Patterns (India) Limited (DATAPATTNS.NS) Bundle
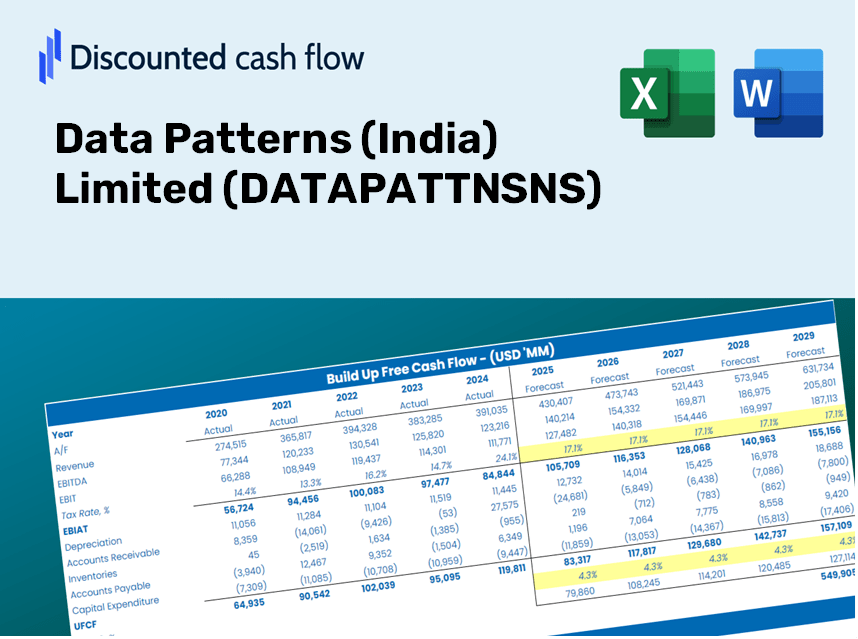
Améliorez vos stratégies d'investissement avec la calculatrice DCF (DataPattNSNS)! Explorez des données financières précises pour les modèles de données (Inde) Limited, ajustez les prévisions et dépenses de croissance et observez instantanément comment ces modifications affectent la valeur intrinsèque de (datapattnsns).
What You'll Receive
- Adjustable Forecast Inputs: Seamlessly modify key assumptions (growth %, margins, WACC) to explore various scenarios.
- Industry-Specific Data: Pre-loaded financial information for Data Patterns (India) Limited (DATAPATTNSNS) to kickstart your analysis.
- Automated DCF Outputs: The template will automatically compute Net Present Value (NPV) and intrinsic value for you.
- Professional and Customizable: A refined Excel model that meets your specific valuation requirements.
- Designed for Analysts and Investors: Perfect for evaluating projections, confirming strategies, and enhancing efficiency.
Key Features
- Customizable Forecast Inputs: Adjust essential variables such as revenue growth, EBITDA %, and capital expenditures.
- Instant DCF Valuation: Automatically computes intrinsic value, NPV, and additional outputs in real time.
- High-Precision Accuracy: Incorporates Data Patterns (India) Limited’s actual financial data for reliable valuation results.
- Streamlined Scenario Analysis: Effortlessly evaluate various assumptions and compare results.
- Efficiency Booster: Avoid the hassle of constructing intricate valuation models from the ground up.
How It Works
- Step 1: Download the Excel file.
- Step 2: Explore Data Patterns (India) Limited's pre-filled financial data and projections.
- Step 3: Adjust key inputs such as revenue growth, WACC, and tax rates (highlighted cells).
- Step 4: Observe how the DCF model updates in real-time as you modify your assumptions.
- Step 5: Review the results and leverage the insights for your investment strategies.
Why Choose This Calculator?
- User-Friendly Interface: Tailored for both novices and seasoned professionals.
- Customizable Inputs: Easily adjust parameters to suit your analytical needs.
- Real-Time Updates: Witness immediate changes in Data Patterns (India) Limited’s valuation as you tweak inputs.
- Pre-Loaded Data: Comes equipped with Data Patterns (India) Limited’s actual financials for effortless analysis.
- Preferred by Experts: Employed by investors and analysts to guide strategic decisions.
Who Should Use This Product?
- Professional Investors: Create comprehensive and trustworthy valuation models for investment analysis in Data Patterns (DATAPATTNSNS).
- Corporate Finance Teams: Evaluate valuation scenarios to inform strategic decisions within their organization.
- Consultants and Advisors: Equip clients with precise valuation insights regarding Data Patterns (DATAPATTNSNS).
- Students and Educators: Utilize real-world data to enhance their understanding and teaching of financial modeling.
- Tech Enthusiasts: Gain insights into how technology firms like Data Patterns (DATAPATTNSNS) are assessed in the market.
Contents of the Template
- Historical Data: Contains DATAPATTNSNS's previous financial performance and baseline projections.
- DCF and Levered DCF Models: Comprehensive templates for determining the intrinsic value of DATAPATTNSNS.
- WACC Sheet: Pre-configured calculations for the Weighted Average Cost of Capital.
- Editable Inputs: Adjust key variables such as growth rates, EBITDA percentages, and capital expenditure assumptions.
- Quarterly and Annual Statements: An extensive overview of DATAPATTNSNS's financial data.
- Interactive Dashboard: Dynamically visualize valuation outcomes and forecasts.
Disclaimer
All information, articles, and product details provided on this website are for general informational and educational purposes only. We do not claim any ownership over, nor do we intend to infringe upon, any trademarks, copyrights, logos, brand names, or other intellectual property mentioned or depicted on this site. Such intellectual property remains the property of its respective owners, and any references here are made solely for identification or informational purposes, without implying any affiliation, endorsement, or partnership.
We make no representations or warranties, express or implied, regarding the accuracy, completeness, or suitability of any content or products presented. Nothing on this website should be construed as legal, tax, investment, financial, medical, or other professional advice. In addition, no part of this site—including articles or product references—constitutes a solicitation, recommendation, endorsement, advertisement, or offer to buy or sell any securities, franchises, or other financial instruments, particularly in jurisdictions where such activity would be unlawful.
All content is of a general nature and may not address the specific circumstances of any individual or entity. It is not a substitute for professional advice or services. Any actions you take based on the information provided here are strictly at your own risk. You accept full responsibility for any decisions or outcomes arising from your use of this website and agree to release us from any liability in connection with your use of, or reliance upon, the content or products found herein.