
|
DCM Shriram Limited (DCMSHriram.NS) Valation DCF |
Entièrement Modifiable: Adapté À Vos Besoins Dans Excel Ou Sheets
Conception Professionnelle: Modèles Fiables Et Conformes Aux Normes Du Secteur
Pré-Construits Pour Une Utilisation Rapide Et Efficace
Compatible MAC/PC, entièrement débloqué
Aucune Expertise N'Est Requise; Facile À Suivre
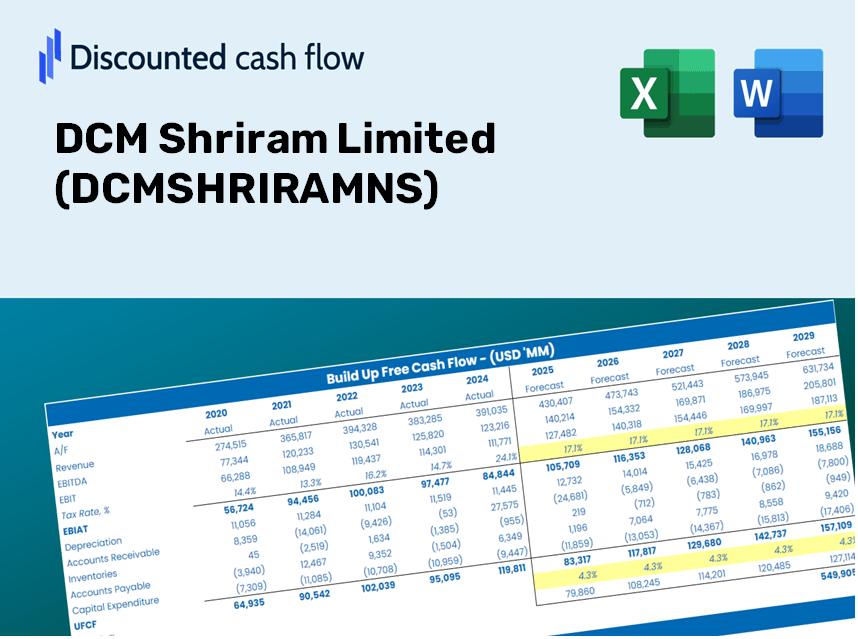
DCM Shriram Limited (DCMSHRIRAM.NS) Bundle
Vous cherchez à déterminer la valeur intrinsèque de DCM Shriram Limited? Notre calculatrice DCF DCM Shriram Limited (DCMShriramns) intègre des données réelles avec des fonctionnalités de personnalisation approfondies, vous permettant d'affiner vos prévisions et d'améliorer vos stratégies d'investissement.
Discounted Cash Flow (DCF) - (USD MM)
| Year | AY1 2021 |
AY2 2022 |
AY3 2023 |
AY4 2024 |
AY5 2025 |
FY1 2026 |
FY2 2027 |
FY3 2028 |
FY4 2029 |
FY5 2030 |
|---|---|---|---|---|---|---|---|---|---|---|
| Revenue | 83,081.6 | 96,274.3 | 115,469.8 | 109,224.8 | 120,773.5 | 133,147.5 | 146,789.3 | 161,828.8 | 178,409.2 | 196,688.4 |
| Revenue Growth, % | 0 | 15.88 | 19.94 | -5.41 | 10.57 | 10.25 | 10.25 | 10.25 | 10.25 | 10.25 |
| EBITDA | 11,152.3 | 17,630.0 | 15,841.0 | 9,634.6 | 13,259.9 | 17,376.9 | 19,157.3 | 21,120.1 | 23,284.0 | 25,669.5 |
| EBITDA, % | 13.42 | 18.31 | 13.72 | 8.82 | 10.98 | 13.05 | 13.05 | 13.05 | 13.05 | 13.05 |
| Depreciation | 2,039.2 | 2,133.2 | 2,369.5 | 2,769.9 | 3,838.7 | 3,311.8 | 3,651.1 | 4,025.2 | 4,437.6 | 4,892.3 |
| Depreciation, % | 2.45 | 2.22 | 2.05 | 2.54 | 3.18 | 2.49 | 2.49 | 2.49 | 2.49 | 2.49 |
| EBIT | 9,113.1 | 15,496.8 | 13,471.5 | 6,864.7 | 9,421.2 | 14,065.1 | 15,506.1 | 17,094.9 | 18,846.3 | 20,777.3 |
| EBIT, % | 10.97 | 16.1 | 11.67 | 6.28 | 7.8 | 10.56 | 10.56 | 10.56 | 10.56 | 10.56 |
| Total Cash | 13,162.2 | 15,124.2 | 9,102.4 | 6,585.1 | 9,860.8 | 14,281.0 | 15,744.2 | 17,357.3 | 19,135.7 | 21,096.2 |
| Total Cash, percent | .0 | .0 | .0 | .0 | .0 | .0 | .0 | .0 | .0 | .0 |
| Account Receivables | 8,614.6 | 9,111.8 | 10,851.0 | 8,859.9 | 11,716.3 | 12,527.4 | 13,810.9 | 15,225.9 | 16,785.9 | 18,505.7 |
| Account Receivables, % | 10.37 | 9.46 | 9.4 | 8.11 | 9.7 | 9.41 | 9.41 | 9.41 | 9.41 | 9.41 |
| Inventories | 18,040.2 | 23,059.4 | 23,764.7 | 26,770.5 | 27,994.8 | 30,340.5 | 33,449.1 | 36,876.1 | 40,654.3 | 44,819.6 |
| Inventories, % | 21.71 | 23.95 | 20.58 | 24.51 | 23.18 | 22.79 | 22.79 | 22.79 | 22.79 | 22.79 |
| Accounts Payable | 7,019.8 | 9,603.1 | 10,107.4 | 10,401.2 | 11,849.4 | 12,385.7 | 13,654.7 | 15,053.7 | 16,596.1 | 18,296.5 |
| Accounts Payable, % | 8.45 | 9.97 | 8.75 | 9.52 | 9.81 | 9.3 | 9.3 | 9.3 | 9.3 | 9.3 |
| Capital Expenditure | -2,538.2 | -7,747.4 | -18,037.5 | -13,098.4 | -8,452.7 | -12,173.5 | -13,420.7 | -14,795.8 | -16,311.7 | -17,982.9 |
| Capital Expenditure, % | -3.06 | -8.05 | -15.62 | -11.99 | -7 | -9.14 | -9.14 | -9.14 | -9.14 | -9.14 |
| Tax Rate, % | 33.55 | 33.55 | 33.55 | 33.55 | 33.55 | 33.55 | 33.55 | 33.55 | 33.55 | 33.55 |
| EBITAT | 6,887.0 | 10,560.9 | 8,683.1 | 4,392.5 | 6,260.0 | 9,525.2 | 10,501.1 | 11,577.0 | 12,763.1 | 14,070.8 |
| Depreciation | ||||||||||
| Changes in Account Receivables | ||||||||||
| Changes in Inventories | ||||||||||
| Changes in Accounts Payable | ||||||||||
| Capital Expenditure | ||||||||||
| UFCF | -13,247.0 | 2,013.6 | -8,925.1 | -6,656.9 | -986.5 | -1,956.9 | -2,391.6 | -2,636.6 | -2,906.7 | -3,204.6 |
| WACC, % | 4.65 | 4.6 | 4.58 | 4.57 | 4.59 | 4.6 | 4.6 | 4.6 | 4.6 | 4.6 |
| PV UFCF | ||||||||||
| SUM PV UFCF | -11,348.1 | |||||||||
| Long Term Growth Rate, % | 3.00 | |||||||||
| Free cash flow (T + 1) | -3,301 | |||||||||
| Terminal Value | -206,340 | |||||||||
| Present Terminal Value | -164,790 | |||||||||
| Enterprise Value | -176,138 | |||||||||
| Net Debt | 15,426 | |||||||||
| Equity Value | -191,564 | |||||||||
| Diluted Shares Outstanding, MM | 156 | |||||||||
| Equity Value Per Share | -1,228.43 |
What You Will Receive
- Customizable Excel Template: A fully adjustable Excel-based DCF Calculator featuring pre-filled financial data for DCM Shriram Limited (DCMSHRIRAMNS).
- Real-World Insights: Access to historical data and forward-looking projections (highlighted in the yellow cells).
- Flexible Forecasting: Easily modify key assumptions such as revenue growth, EBITDA margin, and WACC.
- Instant Calculations: Quickly observe how your inputs influence the valuation of DCM Shriram Limited (DCMSHRIRAMNS).
- Professional Resource: Designed specifically for investors, CFOs, consultants, and financial analysts.
- User-Centric Interface: Organized for simplicity and ease of navigation, complete with step-by-step guidelines.
Key Features
- Comprehensive DCF Calculator: Features detailed unlevered and levered DCF valuation models tailored for DCM Shriram Limited (DCMSHRIRAMNS).
- WACC Calculator: Comes with a pre-structured Weighted Average Cost of Capital sheet that allows for customizable inputs.
- Adjustable Forecast Assumptions: Easily modify growth rates, capital investments, and discount rates to suit your analysis.
- Integrated Financial Ratios: Evaluate profitability, leverage, and efficiency ratios specifically for DCM Shriram Limited (DCMSHRIRAMNS).
- Visualization Dashboard and Charts: Graphical representations provide a summary of key valuation metrics for straightforward analysis.
How It Works
- Download the Template: Access the Excel-based DCM Shriram Limited (DCMSHRIRAMNS) DCF Calculator instantly.
- Input Your Assumptions: Modify the yellow-highlighted cells for growth rates, WACC, margins, and other factors.
- Instant Calculations: The model will automatically update the intrinsic value of DCM Shriram Limited (DCMSHRIRAMNS).
- Test Scenarios: Experiment with different assumptions to see how valuations may change.
- Analyze and Decide: Leverage the results to inform your investment decisions or financial assessments.
Why Opt for This Calculator?
- All-in-One Solution: Seamlessly integrates DCF, WACC, and financial ratio analyses within a single interface.
- Flexible Parameters: Modify the highlighted cells to explore different scenarios and outcomes.
- In-Depth Analysis: Automatically computes the intrinsic value and Net Present Value for DCM Shriram Limited (DCMSHRIRAMNS).
- Preloaded Information: Access to historical and projected data provides a strong foundation for analysis.
- High-Quality Standards: Perfectly suited for financial analysts, investors, and business consultants.
Who Can Benefit from This Product?
- Investors: Assess DCM Shriram Limited's (DCMSHRIRAMNS) valuation before making stock trades.
- CFOs and Financial Analysts: Enhance valuation workflows and evaluate financial projections.
- Startup Founders: Gain insights into how established companies like DCM Shriram Limited are valued.
- Consultants: Create detailed valuation reports for your clients’ needs.
- Students and Educators: Utilize real-world examples to practice and teach valuation methods.
Contents of the Template
- Operating and Balance Sheet Data: Pre-filled historical data and forecasts for DCM Shriram Limited (DCMSHRIRAMNS), including revenue, EBITDA, EBIT, and capital expenditures.
- WACC Calculation: A dedicated sheet for Weighted Average Cost of Capital (WACC), detailing parameters such as Beta, risk-free rate, and share price.
- DCF Valuation (Unlevered and Levered): Customizable Discounted Cash Flow models that showcase intrinsic value with comprehensive calculations.
- Financial Statements: Pre-loaded annual and quarterly financial statements to facilitate thorough analysis.
- Key Ratios: A collection of profitability, leverage, and efficiency ratios pertinent to DCM Shriram Limited (DCMSHRIRAMNS).
- Dashboard and Charts: A visual summary of valuation outputs and underlying assumptions for easier analysis of results.
Disclaimer
All information, articles, and product details provided on this website are for general informational and educational purposes only. We do not claim any ownership over, nor do we intend to infringe upon, any trademarks, copyrights, logos, brand names, or other intellectual property mentioned or depicted on this site. Such intellectual property remains the property of its respective owners, and any references here are made solely for identification or informational purposes, without implying any affiliation, endorsement, or partnership.
We make no representations or warranties, express or implied, regarding the accuracy, completeness, or suitability of any content or products presented. Nothing on this website should be construed as legal, tax, investment, financial, medical, or other professional advice. In addition, no part of this site—including articles or product references—constitutes a solicitation, recommendation, endorsement, advertisement, or offer to buy or sell any securities, franchises, or other financial instruments, particularly in jurisdictions where such activity would be unlawful.
All content is of a general nature and may not address the specific circumstances of any individual or entity. It is not a substitute for professional advice or services. Any actions you take based on the information provided here are strictly at your own risk. You accept full responsibility for any decisions or outcomes arising from your use of this website and agree to release us from any liability in connection with your use of, or reliance upon, the content or products found herein.