
|
Deere & Company (DE) DCF Valuation |
Entièrement Modifiable: Adapté À Vos Besoins Dans Excel Ou Sheets
Conception Professionnelle: Modèles Fiables Et Conformes Aux Normes Du Secteur
Pré-Construits Pour Une Utilisation Rapide Et Efficace
Compatible MAC/PC, entièrement débloqué
Aucune Expertise N'Est Requise; Facile À Suivre
Deere & Company (DE) Bundle
Explore Deere & Company's financial outlook with our user-friendly DCF Calculator! Enter your projections for growth, margins, and expenses to calculate Deere & Company's intrinsic value and optimize your investment decisions.
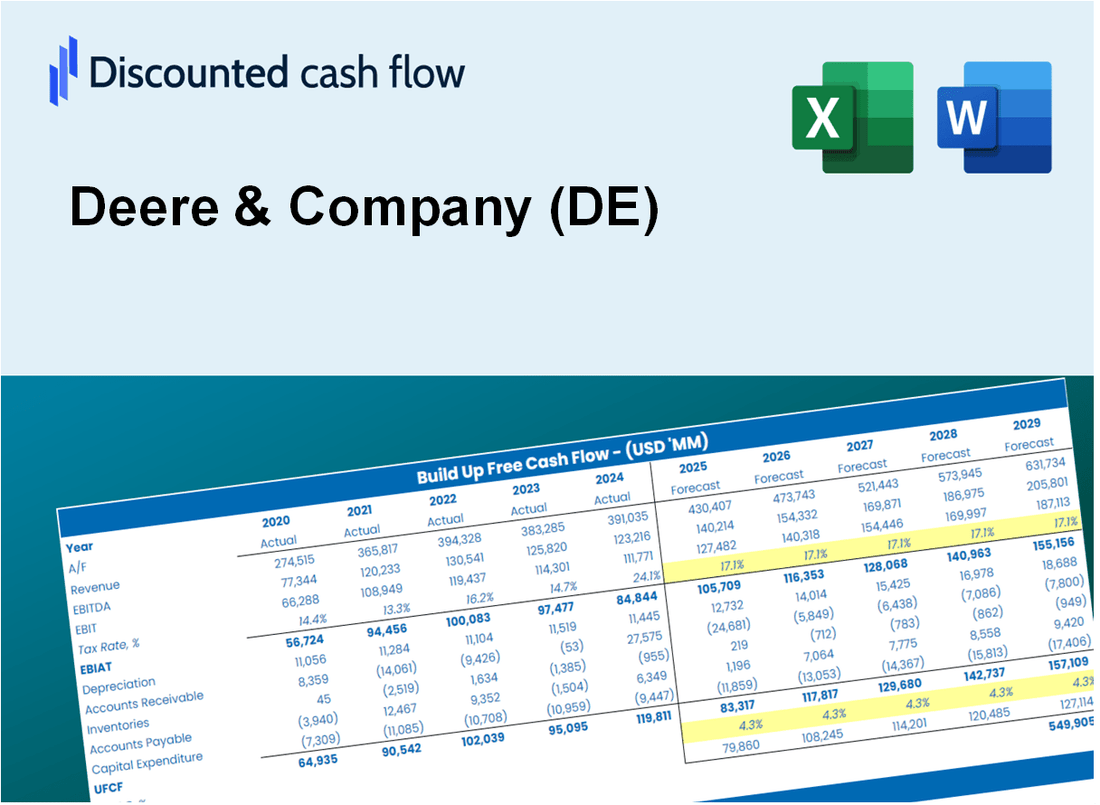
Discounted Cash Flow (DCF) - (USD MM)
| Year | AY1 2021 |
AY2 2022 |
AY3 2023 |
AY4 2024 |
AY5 2025 |
FY1 2026 |
FY2 2027 |
FY3 2028 |
FY4 2029 |
FY5 2030 |
|---|---|---|---|---|---|---|---|---|---|---|
| Revenue | 43,033.0 | 51,282.0 | 60,248.0 | 50,518.0 | 44,665.0 | 45,660.7 | 46,678.5 | 47,719.1 | 48,782.9 | 49,870.3 |
| Revenue Growth, % | 0 | 19.17 | 17.48 | -16.15 | -11.59 | 2.23 | 2.23 | 2.23 | 2.23 | 2.23 |
| EBITDA | 10,645.0 | 12,084.0 | 17,476.0 | 14,672.0 | 11,656.0 | 12,095.2 | 12,364.9 | 12,640.5 | 12,922.3 | 13,210.4 |
| EBITDA, % | 24.74 | 23.56 | 29.01 | 29.04 | 26.1 | 26.49 | 26.49 | 26.49 | 26.49 | 26.49 |
| Depreciation | 2,050.0 | 1,895.0 | 2,004.0 | 2,118.0 | 2,229.0 | 1,914.9 | 1,957.5 | 2,001.2 | 2,045.8 | 2,091.4 |
| Depreciation, % | 4.76 | 3.7 | 3.33 | 4.19 | 4.99 | 4.19 | 4.19 | 4.19 | 4.19 | 4.19 |
| EBIT | 8,595.0 | 10,189.0 | 15,472.0 | 12,554.0 | 9,427.0 | 10,180.4 | 10,407.3 | 10,639.3 | 10,876.5 | 11,119.0 |
| EBIT, % | 19.97 | 19.87 | 25.68 | 24.85 | 21.11 | 22.3 | 22.3 | 22.3 | 22.3 | 22.3 |
| Total Cash | 8,745.0 | 5,508.0 | 8,404.0 | 8,478.0 | 9,687.0 | 7,623.6 | 7,793.6 | 7,967.3 | 8,144.9 | 8,326.5 |
| Total Cash, percent | .0 | .0 | .0 | .0 | .0 | .0 | .0 | .0 | .0 | .0 |
| Account Receivables | 42,693.0 | 48,980.0 | 58,750.0 | 58,361.0 | 57,119.0 | 44,951.5 | 45,953.6 | 46,978.0 | 48,025.2 | 49,095.8 |
| Account Receivables, % | 99.21 | 95.51 | 97.51 | 115.53 | 127.88 | 98.45 | 98.45 | 98.45 | 98.45 | 98.45 |
| Inventories | 6,836.0 | 8,539.0 | 8,219.0 | 7,199.0 | 7,508.0 | 7,053.5 | 7,210.8 | 7,371.5 | 7,535.8 | 7,703.8 |
| Inventories, % | 15.89 | 16.65 | 13.64 | 14.25 | 16.81 | 15.45 | 15.45 | 15.45 | 15.45 | 15.45 |
| Accounts Payable | 3,173.0 | 3,894.0 | 3,467.0 | 2,698.0 | 2,985.0 | 2,990.3 | 3,057.0 | 3,125.1 | 3,194.8 | 3,266.0 |
| Accounts Payable, % | 7.37 | 7.59 | 5.75 | 5.34 | 6.68 | 6.55 | 6.55 | 6.55 | 6.55 | 6.55 |
| Capital Expenditure | -2,580.0 | -3,788.0 | -4,468.0 | -4,802.0 | -4,228.0 | -3,631.8 | -3,712.8 | -3,795.5 | -3,880.1 | -3,966.6 |
| Capital Expenditure, % | -6 | -7.39 | -7.42 | -9.51 | -9.47 | -7.95 | -7.95 | -7.95 | -7.95 | -7.95 |
| Tax Rate, % | 19.66 | 19.66 | 19.66 | 19.66 | 19.66 | 19.66 | 19.66 | 19.66 | 19.66 | 19.66 |
| EBITAT | 6,723.3 | 7,952.0 | 12,075.0 | 9,707.4 | 7,573.8 | 7,981.0 | 8,158.9 | 8,340.8 | 8,526.7 | 8,716.8 |
| Depreciation | ||||||||||
| Changes in Account Receivables | ||||||||||
| Changes in Inventories | ||||||||||
| Changes in Accounts Payable | ||||||||||
| Capital Expenditure | ||||||||||
| UFCF | -40,162.7 | -1,210.0 | -266.0 | 7,663.4 | 6,794.8 | 18,891.3 | 5,311.1 | 5,429.5 | 5,550.5 | 5,674.2 |
| WACC, % | 7.02 | 7.01 | 7.01 | 7 | 7.05 | 7.02 | 7.02 | 7.02 | 7.02 | 7.02 |
| PV UFCF | ||||||||||
| SUM PV UFCF | 34,992.8 | |||||||||
| Long Term Growth Rate, % | 2.00 | |||||||||
| Free cash flow (T + 1) | 5,788 | |||||||||
| Terminal Value | 115,317 | |||||||||
| Present Terminal Value | 82,147 | |||||||||
| Enterprise Value | 117,140 | |||||||||
| Net Debt | 55,660 | |||||||||
| Equity Value | 61,480 | |||||||||
| Diluted Shares Outstanding, MM | 272 | |||||||||
| Equity Value Per Share | 226.28 |
What You Will Get
- Editable Forecast Inputs: Easily adjust key assumptions (growth %, margins, WACC) to explore various scenarios.
- Real-World Data: Deere & Company’s financial data pre-filled to kickstart your analysis.
- Automatic DCF Outputs: The template computes Net Present Value (NPV) and intrinsic value automatically.
- Customizable and Professional: A refined Excel model tailored to meet your valuation requirements.
- Built for Analysts and Investors: Perfect for evaluating projections, validating strategies, and enhancing efficiency.
Key Features
- Customizable Financial Inputs: Adjust essential parameters such as sales growth, operating margin, and investment expenditures.
- Instant DCF Valuation: Quickly computes intrinsic value, NPV, and additional financial metrics.
- High-Precision Results: Leverages Deere & Company's real-world data for accurate valuation assessments.
- Effortless Scenario Testing: Easily evaluate various assumptions and analyze their impacts.
- Efficiency Booster: Avoid the hassle of constructing intricate valuation models from the ground up.
How It Works
- Step 1: Download the prebuilt Excel template featuring Deere & Company's (DE) data.
- Step 2: Navigate through the pre-filled sheets to grasp the essential metrics.
- Step 3: Modify forecasts and assumptions in the editable yellow cells (WACC, growth, margins).
- Step 4: Instantly access recalculated results, including Deere & Company's (DE) intrinsic value.
- Step 5: Make informed investment choices or create reports based on the outputs.
Why Choose This Calculator for Deere & Company (DE)?
- User-Friendly Interface: Perfect for both novices and seasoned professionals.
- Customizable Inputs: Adjust parameters easily to suit your financial analysis.
- Real-Time Valuation: Observe immediate updates to Deere’s valuation as you change inputs.
- Preloaded Data: Comes with Deere’s actual financial information for swift evaluations.
- Relied Upon by Experts: Favored by investors and analysts for making well-informed choices.
Who Should Use This Product?
- Investors: Evaluate Deere & Company's (DE) valuation prior to making stock transactions.
- CFOs and Financial Analysts: Enhance valuation workflows and assess financial forecasts.
- Startup Founders: Understand how leading public companies like Deere & Company are appraised.
- Consultants: Provide expert valuation reports to clients based on Deere & Company's (DE) metrics.
- Students and Educators: Utilize actual data to learn and teach valuation methodologies.
What the Template Contains
- Operating and Balance Sheet Data: Pre-filled Deere & Company (DE) historical data and forecasts, including revenue, EBITDA, EBIT, and capital expenditures.
- WACC Calculation: A dedicated sheet for Weighted Average Cost of Capital (WACC), including parameters like Beta, risk-free rate, and share price.
- DCF Valuation (Unlevered and Levered): Editable Discounted Cash Flow models showing intrinsic value with detailed calculations.
- Financial Statements: Pre-loaded financial statements (annual and quarterly) to support analysis.
- Key Ratios: Includes profitability, leverage, and efficiency ratios for Deere & Company (DE).
- Dashboard and Charts: Visual summary of valuation outputs and assumptions to analyze results easily.
Disclaimer
All information, articles, and product details provided on this website are for general informational and educational purposes only. We do not claim any ownership over, nor do we intend to infringe upon, any trademarks, copyrights, logos, brand names, or other intellectual property mentioned or depicted on this site. Such intellectual property remains the property of its respective owners, and any references here are made solely for identification or informational purposes, without implying any affiliation, endorsement, or partnership.
We make no representations or warranties, express or implied, regarding the accuracy, completeness, or suitability of any content or products presented. Nothing on this website should be construed as legal, tax, investment, financial, medical, or other professional advice. In addition, no part of this site—including articles or product references—constitutes a solicitation, recommendation, endorsement, advertisement, or offer to buy or sell any securities, franchises, or other financial instruments, particularly in jurisdictions where such activity would be unlawful.
All content is of a general nature and may not address the specific circumstances of any individual or entity. It is not a substitute for professional advice or services. Any actions you take based on the information provided here are strictly at your own risk. You accept full responsibility for any decisions or outcomes arising from your use of this website and agree to release us from any liability in connection with your use of, or reliance upon, the content or products found herein.