
|
Diodes Incorporated (Diod) Valation DCF |
Entièrement Modifiable: Adapté À Vos Besoins Dans Excel Ou Sheets
Conception Professionnelle: Modèles Fiables Et Conformes Aux Normes Du Secteur
Pré-Construits Pour Une Utilisation Rapide Et Efficace
Compatible MAC/PC, entièrement débloqué
Aucune Expertise N'Est Requise; Facile À Suivre
Diodes Incorporated (DIOD) Bundle
Gagnez la maîtrise sur vos diodes Incorporated (Diod) Analyse d'évaluation à l'aide de notre calculatrice sophistiquée DCF! Ce modèle Excel est préchargé avec des données réelles (diod), vous permettant d'ajuster les prévisions et les hypothèses pour déterminer avec précision la valeur intrinsèque des diodes incorporées.
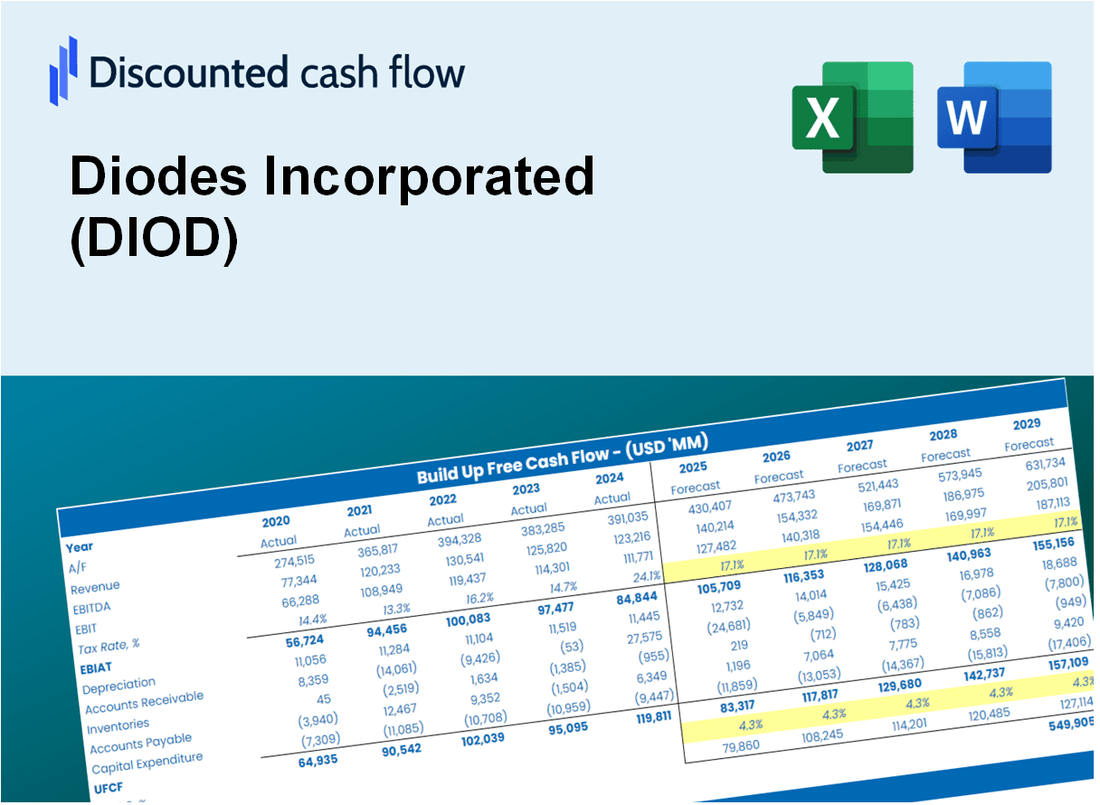
Discounted Cash Flow (DCF) - (USD MM)
| Year | AY1 2020 |
AY2 2021 |
AY3 2022 |
AY4 2023 |
AY5 2024 |
FY1 2025 |
FY2 2026 |
FY3 2027 |
FY4 2028 |
FY5 2029 |
|---|---|---|---|---|---|---|---|---|---|---|
| Revenue | 1,229.2 | 1,805.2 | 2,000.6 | 1,661.7 | 1,311.1 | 1,375.5 | 1,443.1 | 1,513.9 | 1,588.3 | 1,666.3 |
| Revenue Growth, % | 0 | 46.85 | 10.83 | -16.94 | -21.1 | 4.91 | 4.91 | 4.91 | 4.91 | 4.91 |
| EBITDA | 240.0 | 445.0 | 532.0 | 421.0 | 202.2 | 306.8 | 321.9 | 337.7 | 354.3 | 371.7 |
| EBITDA, % | 19.53 | 24.65 | 26.59 | 25.33 | 15.42 | 22.3 | 22.3 | 22.3 | 22.3 | 22.3 |
| Depreciation | 108.0 | 122.4 | 127.8 | 137.3 | 137.1 | 111.9 | 117.4 | 123.2 | 129.2 | 135.6 |
| Depreciation, % | 8.79 | 6.78 | 6.39 | 8.26 | 10.46 | 8.14 | 8.14 | 8.14 | 8.14 | 8.14 |
| EBIT | 132.0 | 322.6 | 404.3 | 283.6 | 65.0 | 194.9 | 204.5 | 214.5 | 225.0 | 236.1 |
| EBIT, % | 10.74 | 17.87 | 20.21 | 17.07 | 4.96 | 14.17 | 14.17 | 14.17 | 14.17 | 14.17 |
| Total Cash | 274.2 | 370.1 | 343.8 | 325.6 | 316.1 | 285.3 | 299.3 | 314.0 | 329.4 | 345.6 |
| Total Cash, percent | .0 | .0 | .0 | .0 | .0 | .0 | .0 | .0 | .0 | .0 |
| Account Receivables | 320.1 | 358.5 | 369.2 | 371.9 | 325.5 | 306.9 | 322.0 | 337.8 | 354.4 | 371.8 |
| Account Receivables, % | 26.04 | 19.86 | 18.46 | 22.38 | 24.83 | 22.31 | 22.31 | 22.31 | 22.31 | 22.31 |
| Inventories | 307.1 | 348.6 | 360.3 | 389.8 | 474.9 | 335.6 | 352.1 | 369.3 | 387.5 | 406.5 |
| Inventories, % | 24.98 | 19.31 | 18.01 | 23.46 | 36.22 | 24.4 | 24.4 | 24.4 | 24.4 | 24.4 |
| Accounts Payable | 168.0 | 221.3 | 160.4 | 158.3 | 133.8 | 147.7 | 154.9 | 162.5 | 170.5 | 178.9 |
| Accounts Payable, % | 13.67 | 12.26 | 8.02 | 9.52 | 10.2 | 10.73 | 10.73 | 10.73 | 10.73 | 10.73 |
| Capital Expenditure | -75.8 | -141.2 | -211.7 | -150.8 | -73.0 | -107.9 | -113.2 | -118.7 | -124.6 | -130.7 |
| Capital Expenditure, % | -6.17 | -7.82 | -10.58 | -9.07 | -5.57 | -7.84 | -7.84 | -7.84 | -7.84 | -7.84 |
| Tax Rate, % | 29.77 | 29.77 | 29.77 | 29.77 | 29.77 | 29.77 | 29.77 | 29.77 | 29.77 | 29.77 |
| EBITAT | 107.6 | 234.2 | 338.2 | 231.8 | 45.7 | 151.9 | 159.4 | 167.2 | 175.4 | 184.0 |
| Depreciation | ||||||||||
| Changes in Account Receivables | ||||||||||
| Changes in Inventories | ||||||||||
| Changes in Accounts Payable | ||||||||||
| Capital Expenditure | ||||||||||
| UFCF | -319.3 | 188.7 | 171.1 | 184.0 | 46.5 | 327.8 | 139.3 | 146.1 | 153.3 | 160.9 |
| WACC, % | 11.14 | 11.12 | 11.14 | 11.14 | 11.12 | 11.13 | 11.13 | 11.13 | 11.13 | 11.13 |
| PV UFCF | ||||||||||
| SUM PV UFCF | 709.7 | |||||||||
| Long Term Growth Rate, % | 2.00 | |||||||||
| Free cash flow (T + 1) | 164 | |||||||||
| Terminal Value | 1,797 | |||||||||
| Present Terminal Value | 1,060 | |||||||||
| Enterprise Value | 1,770 | |||||||||
| Net Debt | -217 | |||||||||
| Equity Value | 1,987 | |||||||||
| Diluted Shares Outstanding, MM | 46 | |||||||||
| Equity Value Per Share | 42.81 |
What You Will Get
- Real Diodes Data: Preloaded financials – from revenue to EBIT – based on actual and projected figures.
- Full Customization: Adjust all critical parameters (yellow cells) like WACC, growth %, and tax rates.
- Instant Valuation Updates: Automatic recalculations to analyze the impact of changes on Diodes Incorporated’s fair value.
- Versatile Excel Template: Tailored for quick edits, scenario testing, and detailed projections.
- Time-Saving and Accurate: Skip building models from scratch while maintaining precision and flexibility.
Key Features
- Comprehensive DCF Calculator: Features detailed unlevered and levered DCF valuation models tailored for Diodes Incorporated (DIOD).
- WACC Calculator: Pre-built Weighted Average Cost of Capital sheet with customizable parameters for accurate analysis.
- Adjustable Forecast Assumptions: Easily modify growth rates, capital expenditures, and discount rates to suit your analysis needs.
- Integrated Financial Ratios: Evaluate profitability, leverage, and efficiency ratios specifically for Diodes Incorporated (DIOD).
- Interactive Dashboard and Charts: Visual representations summarize essential valuation metrics for straightforward analysis.
How It Works
- Download the Template: Gain immediate access to the Excel-based DIOD DCF Calculator.
- Input Your Assumptions: Modify the yellow-highlighted cells for growth rates, WACC, margins, and more.
- Instant Calculations: The model automatically recalculates Diodes Incorporated’s intrinsic value.
- Test Scenarios: Experiment with various assumptions to assess potential changes in valuation.
- Analyze and Decide: Utilize the results to inform your investment or financial analyses.
Why Choose This Calculator for Diodes Incorporated (DIOD)?
- Accuracy: Reliably sourced financials guarantee precise data.
- Flexibility: Tailored for users to experiment with and adjust inputs effortlessly.
- Time-Saving: Eliminate the need to create a DCF model from the ground up.
- Professional-Grade: Crafted with the expertise and usability expected by CFOs.
- User-Friendly: Intuitive design makes it accessible for users without extensive financial modeling skills.
Who Should Use This Product?
- Professional Investors: Develop comprehensive and precise valuation models for portfolio assessments related to Diodes Incorporated (DIOD).
- Corporate Finance Teams: Evaluate valuation scenarios to inform strategic decisions within the organization.
- Consultants and Advisors: Deliver accurate valuation insights for clients interested in Diodes Incorporated (DIOD) stock.
- Students and Educators: Utilize real-world data to enhance learning and practice in financial modeling.
- Tech Enthusiasts: Gain insights into how semiconductor companies like Diodes Incorporated (DIOD) are valued in the marketplace.
What the Template Contains
- Pre-Filled Data: Includes Diodes Incorporated’s historical financials and forecasts.
- Discounted Cash Flow Model: Editable DCF valuation model with automatic calculations.
- Weighted Average Cost of Capital (WACC): A dedicated sheet for calculating WACC based on custom inputs.
- Key Financial Ratios: Analyze Diodes Incorporated’s profitability, efficiency, and leverage.
- Customizable Inputs: Edit revenue growth, margins, and tax rates with ease.
- Clear Dashboard: Charts and tables summarizing key valuation results.
Disclaimer
All information, articles, and product details provided on this website are for general informational and educational purposes only. We do not claim any ownership over, nor do we intend to infringe upon, any trademarks, copyrights, logos, brand names, or other intellectual property mentioned or depicted on this site. Such intellectual property remains the property of its respective owners, and any references here are made solely for identification or informational purposes, without implying any affiliation, endorsement, or partnership.
We make no representations or warranties, express or implied, regarding the accuracy, completeness, or suitability of any content or products presented. Nothing on this website should be construed as legal, tax, investment, financial, medical, or other professional advice. In addition, no part of this site—including articles or product references—constitutes a solicitation, recommendation, endorsement, advertisement, or offer to buy or sell any securities, franchises, or other financial instruments, particularly in jurisdictions where such activity would be unlawful.
All content is of a general nature and may not address the specific circumstances of any individual or entity. It is not a substitute for professional advice or services. Any actions you take based on the information provided here are strictly at your own risk. You accept full responsibility for any decisions or outcomes arising from your use of this website and agree to release us from any liability in connection with your use of, or reliance upon, the content or products found herein.