
|
Danimer Scientific, Inc. (DNMR) Évaluation DCF |
Entièrement Modifiable: Adapté À Vos Besoins Dans Excel Ou Sheets
Conception Professionnelle: Modèles Fiables Et Conformes Aux Normes Du Secteur
Pré-Construits Pour Une Utilisation Rapide Et Efficace
Compatible MAC/PC, entièrement débloqué
Aucune Expertise N'Est Requise; Facile À Suivre
Danimer Scientific, Inc. (DNMR) Bundle
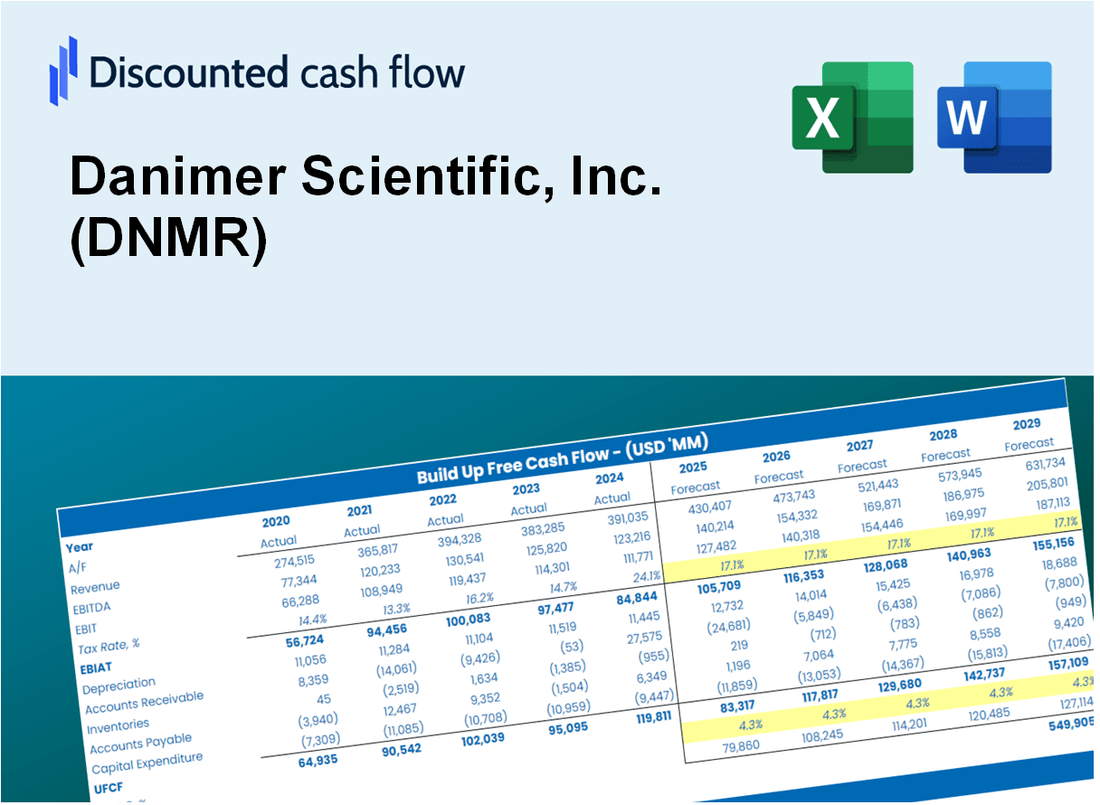
Explorez Danimer Scientific, Inc. (DNMR) Perspectives financières avec notre calculatrice DCF facile à utiliser! Entrez vos hypothèses concernant la croissance, les marges et les coûts pour calculer la valeur intrinsèque de Danimer Scientific, Inc. (DNMR) et améliorer votre stratégie d'investissement.
What You Will Get
- Real DNMR Financial Data: Pre-filled with Danimer Scientific’s historical and projected data for precise analysis.
- Fully Editable Template: Modify key inputs like revenue growth, WACC, and EBITDA % with ease.
- Automatic Calculations: See Danimer Scientific’s intrinsic value update instantly based on your changes.
- Professional Valuation Tool: Designed for investors, analysts, and consultants seeking accurate DCF results.
- User-Friendly Design: Simple structure and clear instructions for all experience levels.
Key Features
- Customizable Growth Metrics: Adjust essential factors such as revenue projections, EBITDA margins, and investment expenditures.
- Instant DCF Valuation: Quickly computes intrinsic value, NPV, and additional financial metrics.
- High-Precision Results: Leverages Danimer Scientific’s actual financial data for accurate valuation assessments.
- Streamlined Scenario Testing: Effortlessly evaluate various assumptions and analyze different outcomes.
- Efficiency Booster: Avoid the hassle of creating intricate valuation models from the ground up.
How It Works
- Step 1: Download the prebuilt Excel template featuring Danimer Scientific's data.
- Step 2: Review the pre-filled sheets to grasp the essential metrics.
- Step 3: Modify forecasts and assumptions in the editable yellow cells (WACC, growth, margins).
- Step 4: Instantly see the updated results, including Danimer Scientific's intrinsic value.
- Step 5: Make informed investment decisions or create reports based on the outputs.
Why Choose This Calculator for Danimer Scientific, Inc. (DNMR)?
- All-in-One Solution: Features DCF, WACC, and comprehensive financial ratio analyses tailored for DNMR.
- Flexible Inputs: Modify yellow-highlighted cells to explore different financial scenarios for Danimer Scientific.
- In-Depth Analysis: Automatically computes the intrinsic value and Net Present Value for Danimer Scientific, Inc.
- Data-Rich Environment: Comes with historical and projected data for precise and reliable calculations.
- Expert-Level Tool: Perfect for financial analysts, investors, and consultants focused on Danimer Scientific, Inc. (DNMR).
Who Should Use Danimer Scientific, Inc. (DNMR)?
- Investors: Gain insights into sustainable investment opportunities with a focus on bioplastics.
- Environmental Analysts: Utilize comprehensive data to evaluate the impact of biodegradable materials on the market.
- Consultants: Easily modify resources for client discussions on eco-friendly product strategies.
- Sustainability Advocates: Enhance your knowledge of innovative solutions in the biopolymer industry.
- Educators and Students: Leverage real-life case studies to enrich learning in environmental science and business courses.
What the Template Contains
- Historical Data: Includes Danimer Scientific’s past financials and baseline forecasts.
- DCF and Levered DCF Models: Detailed templates to calculate Danimer Scientific’s intrinsic value.
- WACC Sheet: Pre-built calculations for Weighted Average Cost of Capital.
- Editable Inputs: Modify key drivers like growth rates, EBITDA %, and CAPEX assumptions.
- Quarterly and Annual Statements: A complete breakdown of Danimer Scientific’s financials.
- Interactive Dashboard: Visualize valuation results and projections dynamically.
Disclaimer
All information, articles, and product details provided on this website are for general informational and educational purposes only. We do not claim any ownership over, nor do we intend to infringe upon, any trademarks, copyrights, logos, brand names, or other intellectual property mentioned or depicted on this site. Such intellectual property remains the property of its respective owners, and any references here are made solely for identification or informational purposes, without implying any affiliation, endorsement, or partnership.
We make no representations or warranties, express or implied, regarding the accuracy, completeness, or suitability of any content or products presented. Nothing on this website should be construed as legal, tax, investment, financial, medical, or other professional advice. In addition, no part of this site—including articles or product references—constitutes a solicitation, recommendation, endorsement, advertisement, or offer to buy or sell any securities, franchises, or other financial instruments, particularly in jurisdictions where such activity would be unlawful.
All content is of a general nature and may not address the specific circumstances of any individual or entity. It is not a substitute for professional advice or services. Any actions you take based on the information provided here are strictly at your own risk. You accept full responsibility for any decisions or outcomes arising from your use of this website and agree to release us from any liability in connection with your use of, or reliance upon, the content or products found herein.