
|
Douglas Elliman Inc. (Doug) Évaluation DCF |
Entièrement Modifiable: Adapté À Vos Besoins Dans Excel Ou Sheets
Conception Professionnelle: Modèles Fiables Et Conformes Aux Normes Du Secteur
Pré-Construits Pour Une Utilisation Rapide Et Efficace
Compatible MAC/PC, entièrement débloqué
Aucune Expertise N'Est Requise; Facile À Suivre
Douglas Elliman Inc. (DOUG) Bundle
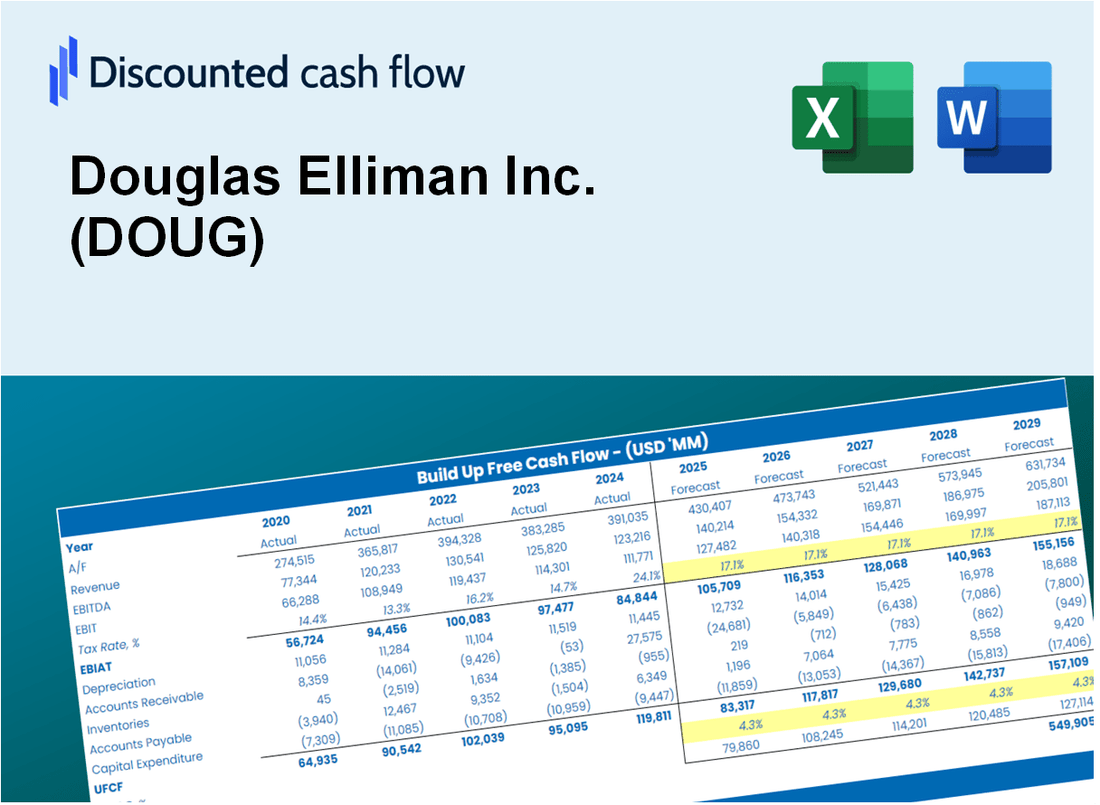
Vous cherchez à évaluer la valeur intrinsèque de Douglas Elliman Inc.? Notre calculatrice (Doug) DCF intègre des données réelles à des options de personnalisation complètes, vous permettant d'affiner vos prévisions et d'améliorer vos stratégies d'investissement.
What You Will Get
- Editable Forecast Inputs: Seamlessly adjust key assumptions (growth %, margins, WACC) to explore various scenarios.
- Real-World Data: Douglas Elliman Inc.’s (DOUG) financial data pre-populated to facilitate your analysis.
- Automatic DCF Outputs: The template computes Net Present Value (NPV) and intrinsic value automatically.
- Customizable and Professional: A refined Excel model tailored to meet your valuation requirements.
- Built for Analysts and Investors: Perfect for evaluating projections, confirming strategies, and enhancing efficiency.
Key Features
- Comprehensive DOUG Data: Pre-filled with Douglas Elliman’s historical performance metrics and future projections.
- Fully Customizable Inputs: Modify sales growth, profit margins, discount rates, tax implications, and capital investments.
- Dynamic Valuation Model: Instant updates to Net Present Value (NPV) and intrinsic value based on user-defined inputs.
- Scenario Analysis: Develop various forecasting scenarios to evaluate different valuation possibilities.
- User-Centric Design: Intuitive, organized, and tailored for both industry experts and novices.
How It Works
- Step 1: Download the Excel file.
- Step 2: Review Douglas Elliman Inc.'s pre-filled financial data and forecasts.
- Step 3: Modify key inputs such as revenue growth, WACC, and tax rates (highlighted cells).
- Step 4: Observe the DCF model update in real-time as you adjust the assumptions.
- Step 5: Analyze the outputs and utilize the results for investment decisions.
Why Choose Douglas Elliman Inc. (DOUG) Calculator?
- Comprehensive Tool: Features advanced analytics for real estate valuation and market trends.
- Customizable Inputs: Modify highlighted fields to explore different real estate scenarios.
- Detailed Insights: Automatically calculates Douglas Elliman's intrinsic value and projected cash flows.
- Preloaded Data: Access to historical performance and market forecasts for precise evaluations.
- Professional Quality: Perfect for real estate analysts, investors, and property consultants.
Who Should Use This Product?
- Real Estate Investors: Evaluate Douglas Elliman Inc.'s (DOUG) market position before making investment decisions.
- Real Estate Professionals: Enhance valuation methods and assess market trends effectively.
- Property Developers: Understand how leading firms like Douglas Elliman Inc. (DOUG) are valued in the industry.
- Consultants: Create detailed valuation reports for real estate clients.
- Students and Educators: Utilize industry data to learn and teach real estate valuation strategies.
What the Template Contains
- Comprehensive DCF Model: Editable template featuring detailed valuation calculations.
- Real-World Data: Douglas Elliman Inc.’s (DOUG) historical and projected financials preloaded for analysis.
- Customizable Parameters: Adjust WACC, growth rates, and tax assumptions to explore various scenarios.
- Financial Statements: Complete annual and quarterly breakdowns for enhanced insights.
- Key Ratios: Integrated analysis for profitability, efficiency, and leverage metrics.
- Dashboard with Visual Outputs: Charts and tables designed for clear, actionable results.
Disclaimer
All information, articles, and product details provided on this website are for general informational and educational purposes only. We do not claim any ownership over, nor do we intend to infringe upon, any trademarks, copyrights, logos, brand names, or other intellectual property mentioned or depicted on this site. Such intellectual property remains the property of its respective owners, and any references here are made solely for identification or informational purposes, without implying any affiliation, endorsement, or partnership.
We make no representations or warranties, express or implied, regarding the accuracy, completeness, or suitability of any content or products presented. Nothing on this website should be construed as legal, tax, investment, financial, medical, or other professional advice. In addition, no part of this site—including articles or product references—constitutes a solicitation, recommendation, endorsement, advertisement, or offer to buy or sell any securities, franchises, or other financial instruments, particularly in jurisdictions where such activity would be unlawful.
All content is of a general nature and may not address the specific circumstances of any individual or entity. It is not a substitute for professional advice or services. Any actions you take based on the information provided here are strictly at your own risk. You accept full responsibility for any decisions or outcomes arising from your use of this website and agree to release us from any liability in connection with your use of, or reliance upon, the content or products found herein.