
|
DRDGOLD LIMITED (DRD) Évaluation DCF |
Entièrement Modifiable: Adapté À Vos Besoins Dans Excel Ou Sheets
Conception Professionnelle: Modèles Fiables Et Conformes Aux Normes Du Secteur
Pré-Construits Pour Une Utilisation Rapide Et Efficace
Compatible MAC/PC, entièrement débloqué
Aucune Expertise N'Est Requise; Facile À Suivre
DRDGOLD Limited (DRD) Bundle
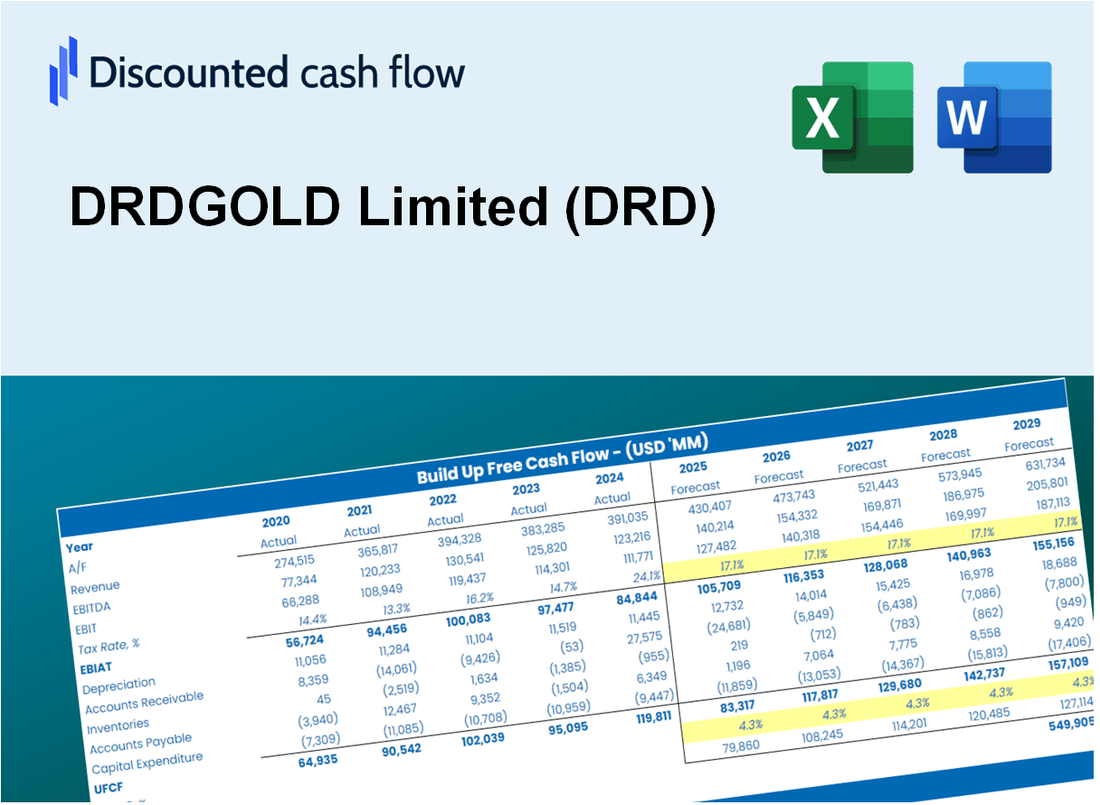
Maximisez l'efficacité et améliorez la précision avec notre calculatrice DCF (DRD)! En utilisant des données réelles de DRDGold Limited et personnalisables, cet outil vous permet de prévoir, analyser et évaluer (DRD) comme un investisseur chevronné.
What You Will Receive
- Comprehensive Financial Model: DRDGOLD Limited’s actual data facilitates accurate DCF valuation.
- Complete Forecasting Flexibility: Modify revenue growth, margins, WACC, and other essential factors.
- Real-Time Calculations: Automatic updates allow you to view results instantly as adjustments are made.
- Professional-Grade Template: A polished Excel file crafted for expert-level valuation.
- Adaptable and Repeatable: Designed for versatility, enabling ongoing use for in-depth forecasts.
Key Features
- Comprehensive DRDGOLD Financials: Gain access to precise pre-loaded historical data and future forecasts.
- Adjustable Forecast Assumptions: Modify highlighted fields such as WACC, growth rates, and profit margins.
- Real-Time Calculations: Instant updates for DCF, Net Present Value (NPV), and cash flow evaluations.
- User-Friendly Dashboard: Clear charts and summaries to help you visualize your valuation outcomes.
- Suitable for All Experience Levels: An intuitive layout designed for investors, CFOs, and consultants alike.
How It Works
- Step 1: Download the Excel file.
- Step 2: Review pre-entered DRDGOLD Limited (DRD) data (historical and projected).
- Step 3: Adjust key assumptions (yellow cells) based on your analysis.
- Step 4: View automatic recalculations for DRDGOLD Limited (DRD)’s intrinsic value.
- Step 5: Use the outputs for investment decisions or reporting.
Why Choose This Calculator for DRDGOLD Limited (DRD)?
- Designed for Industry Experts: A sophisticated tool tailored for analysts, CFOs, and financial consultants.
- Accurate Data Integration: DRDGOLD's historical and projected financials are preloaded for precision.
- Versatile Scenario Analysis: Effortlessly simulate various forecasts and assumptions.
- Comprehensive Outputs: Instantly computes intrinsic value, NPV, and essential metrics.
- User-Friendly Interface: Step-by-step guidance ensures a smooth experience throughout the process.
Who Should Use This Product?
- Investors: Accurately assess DRDGOLD Limited’s (DRD) fair value before making investment choices.
- CFOs: Utilize a professional-grade DCF model for financial analysis and reporting for DRDGOLD Limited (DRD).
- Consultants: Effortlessly customize the template for valuation reports tailored to DRDGOLD Limited (DRD) clients.
- Entrepreneurs: Obtain insights into financial modeling practices employed by leading mining companies, including DRDGOLD Limited (DRD).
- Educators: Implement it as a teaching resource to illustrate valuation techniques relevant to DRDGOLD Limited (DRD).
What the Template Contains
- Comprehensive DCF Model: Editable template featuring detailed valuation calculations for DRDGOLD Limited (DRD).
- Real-World Data: DRDGOLD's historical and projected financials preloaded for thorough analysis.
- Customizable Parameters: Adjust WACC, growth rates, and tax assumptions to explore various scenarios.
- Financial Statements: Complete annual and quarterly breakdowns for enhanced insights into DRDGOLD's performance.
- Key Ratios: Integrated analysis covering profitability, efficiency, and leverage metrics.
- Dashboard with Visual Outputs: Charts and tables providing clear, actionable results for informed decision-making.
Disclaimer
All information, articles, and product details provided on this website are for general informational and educational purposes only. We do not claim any ownership over, nor do we intend to infringe upon, any trademarks, copyrights, logos, brand names, or other intellectual property mentioned or depicted on this site. Such intellectual property remains the property of its respective owners, and any references here are made solely for identification or informational purposes, without implying any affiliation, endorsement, or partnership.
We make no representations or warranties, express or implied, regarding the accuracy, completeness, or suitability of any content or products presented. Nothing on this website should be construed as legal, tax, investment, financial, medical, or other professional advice. In addition, no part of this site—including articles or product references—constitutes a solicitation, recommendation, endorsement, advertisement, or offer to buy or sell any securities, franchises, or other financial instruments, particularly in jurisdictions where such activity would be unlawful.
All content is of a general nature and may not address the specific circumstances of any individual or entity. It is not a substitute for professional advice or services. Any actions you take based on the information provided here are strictly at your own risk. You accept full responsibility for any decisions or outcomes arising from your use of this website and agree to release us from any liability in connection with your use of, or reliance upon, the content or products found herein.