
|
Dermata Therapeutics, Inc. (DRMA) Évaluation DCF |
Entièrement Modifiable: Adapté À Vos Besoins Dans Excel Ou Sheets
Conception Professionnelle: Modèles Fiables Et Conformes Aux Normes Du Secteur
Pré-Construits Pour Une Utilisation Rapide Et Efficace
Compatible MAC/PC, entièrement débloqué
Aucune Expertise N'Est Requise; Facile À Suivre
Dermata Therapeutics, Inc. (DRMA) Bundle
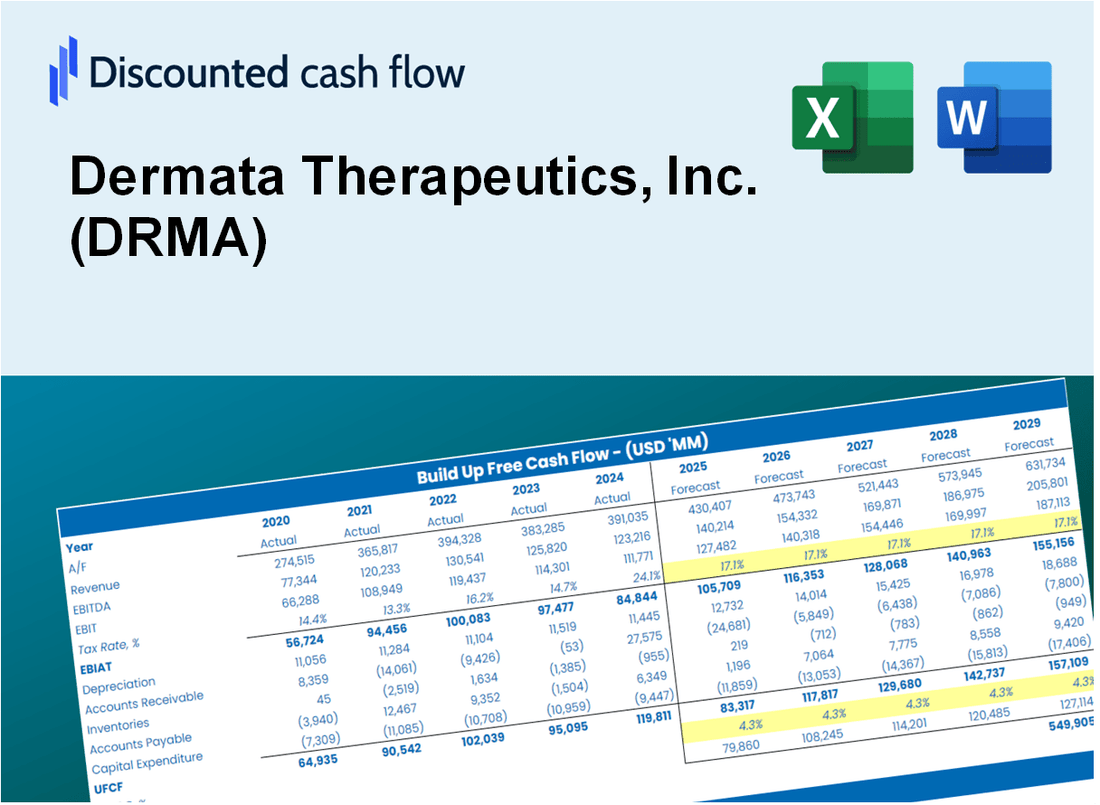
Explorez Dermata Therapeutics, Inc. (DRMA) Fuillon financier avec notre calculatrice DCF conviviale! Entrez vos hypothèses de croissance, de marges et de coûts pour calculer la valeur intrinsèque de Dermata Therapeutics, Inc. (DRMA) et affiner votre approche d'investissement.
Discounted Cash Flow (DCF) - (USD MM)
| Year | AY1 2020 |
AY2 2021 |
AY3 2022 |
AY4 2023 |
AY5 2024 |
FY1 2025 |
FY2 2026 |
FY3 2027 |
FY4 2028 |
FY5 2029 |
|---|---|---|---|---|---|---|---|---|---|---|
| Revenue | .0 | .0 | .0 | .0 | .0 | .0 | .0 | .0 | .0 | .0 |
| Revenue Growth, % | 0 | 0 | 0 | 0 | 0 | 0 | 0 | 0 | 0 | 0 |
| EBITDA | -3.2 | -7.9 | .1 | .2 | -12.3 | .0 | .0 | .0 | .0 | .0 |
| EBITDA, % | 100 | 100 | 100 | 100 | 100 | 100 | 100 | 100 | 100 | 100 |
| Depreciation | .0 | .0 | 9.7 | 8.0 | 12.5 | .0 | .0 | .0 | .0 | .0 |
| Depreciation, % | 100 | 100 | 100 | 100 | 100 | 100 | 100 | 100 | 100 | 100 |
| EBIT | -3.2 | -7.9 | -9.6 | -7.8 | -24.8 | .0 | .0 | .0 | .0 | .0 |
| EBIT, % | 100 | 100 | 100 | 100 | 100 | 100 | 100 | 100 | 100 | 100 |
| Total Cash | .5 | 10.8 | 6.2 | 7.4 | 3.2 | .0 | .0 | .0 | .0 | .0 |
| Total Cash, percent | .0 | .0 | .0 | .0 | .0 | .0 | .0 | .0 | .0 | .0 |
| Account Receivables | .0 | .0 | .0 | .0 | .0 | .0 | .0 | .0 | .0 | .0 |
| Account Receivables, % | 100 | 100 | 100 | 100 | 100 | 100 | 100 | 100 | 100 | 100 |
| Inventories | .0 | .0 | .0 | .0 | .0 | .0 | .0 | .0 | .0 | .0 |
| Inventories, % | 100 | 100 | 100 | 100 | 100 | 100 | 100 | 100 | 100 | 100 |
| Accounts Payable | .1 | .5 | .5 | .9 | .8 | .0 | .0 | .0 | .0 | .0 |
| Accounts Payable, % | 100 | 100 | 100 | 100 | 100 | 100 | 100 | 100 | 100 | 100 |
| Capital Expenditure | .0 | .0 | .0 | .0 | .0 | .0 | .0 | .0 | .0 | .0 |
| Capital Expenditure, % | 100 | 100 | 100 | 100 | 100 | 0 | 0 | 0 | 0 | 0 |
| Tax Rate, % | 0 | 0 | 0 | 0 | 0 | 0 | 0 | 0 | 0 | 0 |
| EBITAT | -3.2 | -7.9 | -9.6 | -7.8 | -24.8 | .0 | .0 | .0 | .0 | .0 |
| Depreciation | ||||||||||
| Changes in Account Receivables | ||||||||||
| Changes in Inventories | ||||||||||
| Changes in Accounts Payable | ||||||||||
| Capital Expenditure | ||||||||||
| UFCF | -3.1 | -7.4 | .0 | .6 | -12.3 | -.8 | .0 | .0 | .0 | .0 |
| WACC, % | 6.26 | 6.26 | 6.26 | 6.26 | 6.26 | 6.26 | 6.26 | 6.26 | 6.26 | 6.26 |
| PV UFCF | ||||||||||
| SUM PV UFCF | -.8 | |||||||||
| Long Term Growth Rate, % | 2.00 | |||||||||
| Free cash flow (T + 1) | 0 | |||||||||
| Terminal Value | 0 | |||||||||
| Present Terminal Value | 0 | |||||||||
| Enterprise Value | -1 | |||||||||
| Net Debt | -3 | |||||||||
| Equity Value | 2 | |||||||||
| Diluted Shares Outstanding, MM | 0 | |||||||||
| Equity Value Per Share | 15.69 |
What You Will Get
- Real Dermata Data: Preloaded financials – from revenue to EBIT – based on actual and projected figures for Dermata Therapeutics, Inc. (DRMA).
- Full Customization: Adjust all critical parameters (yellow cells) like WACC, growth %, and tax rates to fit your analysis needs.
- Instant Valuation Updates: Automatic recalculations to analyze the impact of changes on Dermata's fair value.
- Versatile Excel Template: Tailored for quick edits, scenario testing, and detailed projections specific to Dermata Therapeutics, Inc. (DRMA).
- Time-Saving and Accurate: Skip building models from scratch while maintaining precision and flexibility for your financial assessments.
Key Features
- Comprehensive DCF Calculator: Features extensive unlevered and levered DCF valuation frameworks.
- WACC Calculator: Includes a pre-configured Weighted Average Cost of Capital sheet with adjustable inputs.
- Customizable Forecast Assumptions: Tailor growth rates, capital expenditures, and discount rates to your needs.
- Integrated Financial Ratios: Evaluate profitability, leverage, and efficiency ratios specific to Dermata Therapeutics, Inc. (DRMA).
- Interactive Dashboard and Charts: Visual representations highlight essential valuation metrics for straightforward analysis.
How It Works
- Step 1: Download the Excel file for Dermata Therapeutics, Inc. (DRMA).
- Step 2: Review Dermata's pre-filled financial data and projections.
- Step 3: Adjust key inputs such as revenue growth, WACC, and tax rates (highlighted cells).
- Step 4: Observe the DCF model refresh in real-time as you modify assumptions.
- Step 5: Evaluate the outputs and leverage the results for your investment strategies.
Why Choose Dermata Therapeutics, Inc. (DRMA) Calculator?
- Comprehensive Tool: Integrates DCF, WACC, and financial ratio analyses tailored for Dermata Therapeutics.
- Customizable Inputs: Modify yellow-highlighted fields to explore different financial scenarios.
- Detailed Insights: Automatically computes Dermata's intrinsic value and Net Present Value for informed decision-making.
- Preloaded Data: Access to historical and projected data for precise analysis.
- Professional Quality: Perfect for financial analysts, investors, and healthcare consultants focusing on biotech.
Who Should Use This Product?
- Individual Investors: Gain insights for informed decisions when trading Dermata Therapeutics (DRMA) stock.
- Financial Analysts: Enhance valuation methodologies with accessible financial models specific to Dermata Therapeutics.
- Consultants: Provide clients with accurate and timely valuation insights related to Dermata Therapeutics (DRMA).
- Business Owners: Learn how biotechnology companies like Dermata Therapeutics are valued to inform your strategic planning.
- Finance Students: Explore valuation techniques through real-world examples involving Dermata Therapeutics (DRMA).
What the Template Contains
- Preloaded DRMA Data: Historical and projected financial data, including revenue, EBIT, and capital expenditures.
- DCF and WACC Models: Professional-grade sheets for calculating intrinsic value and Weighted Average Cost of Capital.
- Editable Inputs: Yellow-highlighted cells for adjusting revenue growth, tax rates, and discount rates.
- Financial Statements: Comprehensive annual and quarterly financials for deeper analysis.
- Key Ratios: Profitability, leverage, and efficiency ratios to evaluate performance.
- Dashboard and Charts: Visual summaries of valuation outcomes and assumptions.
Disclaimer
All information, articles, and product details provided on this website are for general informational and educational purposes only. We do not claim any ownership over, nor do we intend to infringe upon, any trademarks, copyrights, logos, brand names, or other intellectual property mentioned or depicted on this site. Such intellectual property remains the property of its respective owners, and any references here are made solely for identification or informational purposes, without implying any affiliation, endorsement, or partnership.
We make no representations or warranties, express or implied, regarding the accuracy, completeness, or suitability of any content or products presented. Nothing on this website should be construed as legal, tax, investment, financial, medical, or other professional advice. In addition, no part of this site—including articles or product references—constitutes a solicitation, recommendation, endorsement, advertisement, or offer to buy or sell any securities, franchises, or other financial instruments, particularly in jurisdictions where such activity would be unlawful.
All content is of a general nature and may not address the specific circumstances of any individual or entity. It is not a substitute for professional advice or services. Any actions you take based on the information provided here are strictly at your own risk. You accept full responsibility for any decisions or outcomes arising from your use of this website and agree to release us from any liability in connection with your use of, or reliance upon, the content or products found herein.