
|
DT Midstream, Inc. (DTM) Évaluation DCF |
Entièrement Modifiable: Adapté À Vos Besoins Dans Excel Ou Sheets
Conception Professionnelle: Modèles Fiables Et Conformes Aux Normes Du Secteur
Pré-Construits Pour Une Utilisation Rapide Et Efficace
Compatible MAC/PC, entièrement débloqué
Aucune Expertise N'Est Requise; Facile À Suivre
DT Midstream, Inc. (DTM) Bundle
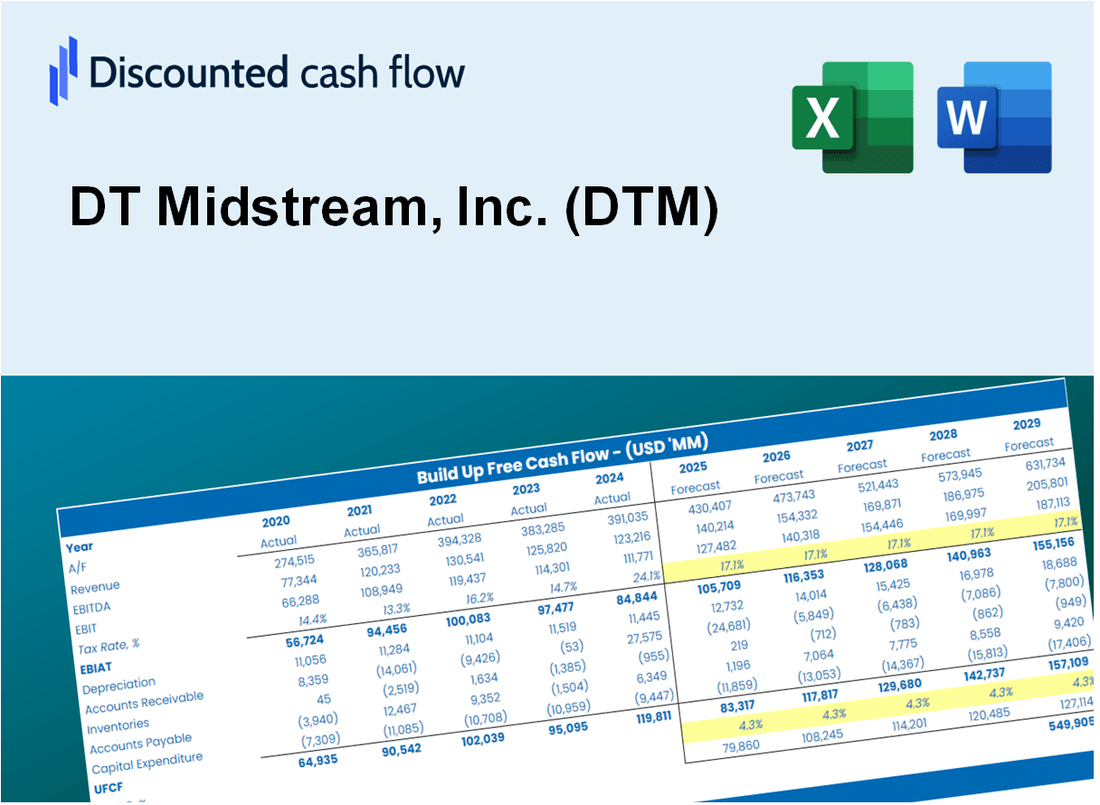
Gagnez la maîtrise sur votre analyse d'évaluation DT Midstream, Inc. (DTM) à l'aide de notre calculatrice sophistiquée DCF! Avec des données en temps réel pour (DTM), ce modèle Excel vous permet d'ajuster les prévisions et les hypothèses pour déterminer avec précision la valeur intrinsèque de DT Midstream, Inc.
What You Will Get
- Real DTM Data: Preloaded financials – from revenue to EBIT – based on actual and projected figures for DT Midstream, Inc. (DTM).
- Full Customization: Adjust all critical parameters (yellow cells) like WACC, growth %, and tax rates to suit your analysis.
- Instant Valuation Updates: Automatic recalculations to assess the impact of changes on DT Midstream’s fair value.
- Versatile Excel Template: Designed for quick edits, scenario testing, and comprehensive projections.
- Time-Saving and Accurate: Eliminate the need to build models from scratch while ensuring precision and flexibility.
Key Features
- Customizable Financial Metrics: Adjust essential inputs such as revenue projections, operating margins, and capital investment plans.
- Instant DCF Valuation: Automatically computes intrinsic value, net present value (NPV), and other financial metrics in real-time.
- High-Precision Accuracy: Leverages DT Midstream's actual financial data for credible valuation results.
- Simplified Scenario Analysis: Effortlessly evaluate various scenarios and analyze their impacts on financial outcomes.
- Efficiency Booster: Streamline the valuation process without the hassle of constructing intricate financial models from the ground up.
How It Works
- Download the Template: Gain immediate access to the Excel-based DTM DCF Calculator.
- Input Your Assumptions: Modify the yellow-highlighted cells for growth rates, WACC, margins, and other variables.
- Instant Calculations: The model will automatically refresh DTM’s intrinsic value.
- Test Scenarios: Experiment with various assumptions to assess potential valuation shifts.
- Analyze and Decide: Utilize the results to inform your investment or financial analysis.
Why Choose DT Midstream, Inc. (DTM) Calculator?
- Save Time: Quickly access a comprehensive DCF model without the hassle of building one from the ground up.
- Enhance Accuracy: Utilize dependable financial data and formulas to minimize valuation errors.
- Completely Customizable: Adjust the model to align with your unique assumptions and forecasts.
- User-Friendly: Intuitive charts and outputs facilitate straightforward analysis of the results.
- Endorsed by Professionals: Crafted for experts who prioritize accuracy and functionality.
Who Should Use This Product?
- Investors: Accurately estimate DT Midstream, Inc.’s (DTM) fair value before making investment decisions.
- CFOs: Utilize a professional-grade DCF model for financial reporting and analysis related to DT Midstream, Inc. (DTM).
- Consultants: Quickly customize the template for valuation reports tailored to DT Midstream, Inc. (DTM) clients.
- Entrepreneurs: Gain insights into financial modeling practices employed by leading energy companies like DT Midstream, Inc. (DTM).
- Educators: Use it as a teaching tool to illustrate valuation methodologies relevant to DT Midstream, Inc. (DTM).
What the Template Contains
- Historical Data: Includes DT Midstream, Inc. (DTM)’s past financials and baseline forecasts.
- DCF and Levered DCF Models: Detailed templates to calculate DT Midstream, Inc. (DTM)’s intrinsic value.
- WACC Sheet: Pre-built calculations for Weighted Average Cost of Capital.
- Editable Inputs: Modify key drivers like growth rates, EBITDA %, and CAPEX assumptions.
- Quarterly and Annual Statements: A complete breakdown of DT Midstream, Inc. (DTM)’s financials.
- Interactive Dashboard: Visualize valuation results and projections dynamically.
Disclaimer
All information, articles, and product details provided on this website are for general informational and educational purposes only. We do not claim any ownership over, nor do we intend to infringe upon, any trademarks, copyrights, logos, brand names, or other intellectual property mentioned or depicted on this site. Such intellectual property remains the property of its respective owners, and any references here are made solely for identification or informational purposes, without implying any affiliation, endorsement, or partnership.
We make no representations or warranties, express or implied, regarding the accuracy, completeness, or suitability of any content or products presented. Nothing on this website should be construed as legal, tax, investment, financial, medical, or other professional advice. In addition, no part of this site—including articles or product references—constitutes a solicitation, recommendation, endorsement, advertisement, or offer to buy or sell any securities, franchises, or other financial instruments, particularly in jurisdictions where such activity would be unlawful.
All content is of a general nature and may not address the specific circumstances of any individual or entity. It is not a substitute for professional advice or services. Any actions you take based on the information provided here are strictly at your own risk. You accept full responsibility for any decisions or outcomes arising from your use of this website and agree to release us from any liability in connection with your use of, or reliance upon, the content or products found herein.