
|
DOWLAIS GROUP PLC (DWL.L) Évaluation DCF |
Entièrement Modifiable: Adapté À Vos Besoins Dans Excel Ou Sheets
Conception Professionnelle: Modèles Fiables Et Conformes Aux Normes Du Secteur
Pré-Construits Pour Une Utilisation Rapide Et Efficace
Compatible MAC/PC, entièrement débloqué
Aucune Expertise N'Est Requise; Facile À Suivre
Dowlais Group plc (DWL.L) Bundle
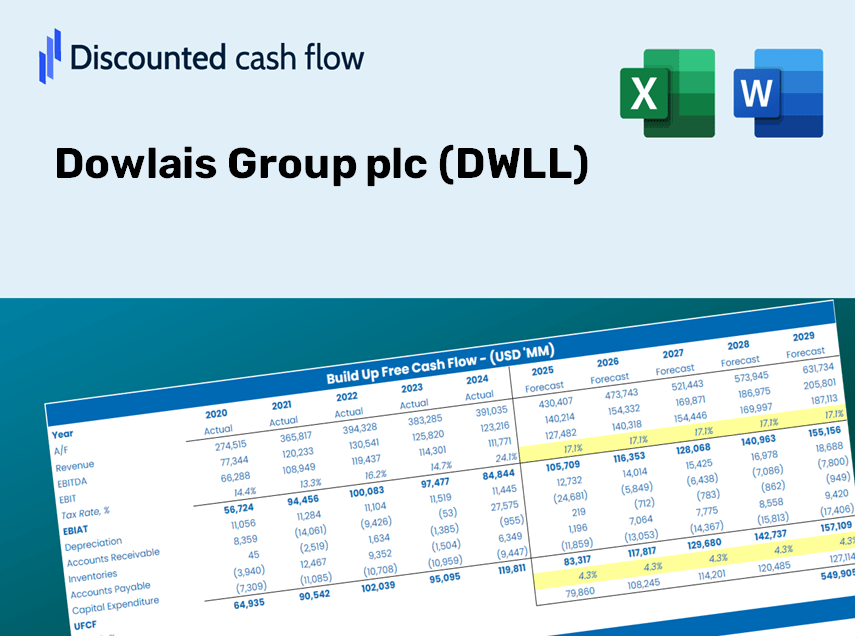
En tant qu'investisseur ou analyste, la calculatrice DCF DOWLais Group Plc (DWLL) est votre ressource incontournable pour une évaluation précise. Équipé de données réelles de Dowlais Group PLC, vous pouvez facilement ajuster les prévisions et observer les effets en temps réel.
Discounted Cash Flow (DCF) - (USD MM)
| Year | AY1 2020 |
AY2 2021 |
AY3 2022 |
AY4 2023 |
AY5 2024 |
FY1 2025 |
FY2 2026 |
FY3 2027 |
FY4 2028 |
FY5 2029 |
|---|---|---|---|---|---|---|---|---|---|---|
| Revenue | 4,126.0 | 4,123.0 | 4,595.0 | 4,864.0 | 4,337.0 | 4,406.3 | 4,476.8 | 4,548.3 | 4,621.1 | 4,694.9 |
| Revenue Growth, % | 0 | -0.07270965 | 11.45 | 5.85 | -10.83 | 1.6 | 1.6 | 1.6 | 1.6 | 1.6 |
| EBITDA | 342.0 | 263.0 | 386.0 | 31.0 | 345.0 | 279.0 | 283.5 | 288.0 | 292.6 | 297.3 |
| EBITDA, % | 8.29 | 6.38 | 8.4 | 0.63734 | 7.95 | 6.33 | 6.33 | 6.33 | 6.33 | 6.33 |
| Depreciation | 548.0 | 518.0 | 459.0 | 459.0 | 449.0 | 490.2 | 498.0 | 506.0 | 514.1 | 522.3 |
| Depreciation, % | 13.28 | 12.56 | 9.99 | 9.44 | 10.35 | 11.12 | 11.12 | 11.12 | 11.12 | 11.12 |
| EBIT | -206.0 | -255.0 | -73.0 | -428.0 | -104.0 | -211.2 | -214.6 | -218.0 | -221.5 | -225.0 |
| EBIT, % | -4.99 | -6.18 | -1.59 | -8.8 | -2.4 | -4.79 | -4.79 | -4.79 | -4.79 | -4.79 |
| Total Cash | 141.0 | 275.0 | 270.0 | 313.0 | 354.0 | 269.3 | 273.6 | 278.0 | 282.4 | 287.0 |
| Total Cash, percent | .0 | .0 | .0 | .0 | .0 | .0 | .0 | .0 | .0 | .0 |
| Account Receivables | 610.0 | 500.0 | 647.0 | 639.0 | 460.0 | 570.5 | 579.6 | 588.9 | 598.3 | 607.9 |
| Account Receivables, % | 14.78 | 12.13 | 14.08 | 13.14 | 10.61 | 12.95 | 12.95 | 12.95 | 12.95 | 12.95 |
| Inventories | 437.0 | 436.0 | 498.0 | 510.0 | 431.0 | 462.0 | 469.4 | 476.9 | 484.5 | 492.3 |
| Inventories, % | 10.59 | 10.57 | 10.84 | 10.49 | 9.94 | 10.49 | 10.49 | 10.49 | 10.49 | 10.49 |
| Accounts Payable | 621.0 | 579.0 | 714.0 | 698.0 | 577.0 | 637.0 | 647.2 | 657.6 | 668.1 | 678.8 |
| Accounts Payable, % | 15.05 | 14.04 | 15.54 | 14.35 | 13.3 | 14.46 | 14.46 | 14.46 | 14.46 | 14.46 |
| Capital Expenditure | -185.0 | -168.0 | -222.0 | -295.0 | -191.0 | -210.3 | -213.6 | -217.0 | -220.5 | -224.0 |
| Capital Expenditure, % | -4.48 | -4.07 | -4.83 | -6.06 | -4.4 | -4.77 | -4.77 | -4.77 | -4.77 | -4.77 |
| Tax Rate, % | 19.53 | 19.53 | 19.53 | 19.53 | 19.53 | 19.53 | 19.53 | 19.53 | 19.53 | 19.53 |
| EBITAT | -183.0 | -303.2 | -95.0 | -374.2 | -83.7 | -192.9 | -196.0 | -199.1 | -202.3 | -205.5 |
| Depreciation | ||||||||||
| Changes in Account Receivables | ||||||||||
| Changes in Inventories | ||||||||||
| Changes in Accounts Payable | ||||||||||
| Capital Expenditure | ||||||||||
| UFCF | -246.0 | 115.8 | 68.0 | -230.2 | 311.3 | 5.6 | 82.1 | 83.4 | 84.7 | 86.1 |
| WACC, % | 6.11 | 6.57 | 6.57 | 6.05 | 5.77 | 6.21 | 6.21 | 6.21 | 6.21 | 6.21 |
| PV UFCF | ||||||||||
| SUM PV UFCF | 277.9 | |||||||||
| Long Term Growth Rate, % | 2.00 | |||||||||
| Free cash flow (T + 1) | 88 | |||||||||
| Terminal Value | 2,084 | |||||||||
| Present Terminal Value | 1,542 | |||||||||
| Enterprise Value | 1,820 | |||||||||
| Net Debt | 1,100 | |||||||||
| Equity Value | 720 | |||||||||
| Diluted Shares Outstanding, MM | 1,357 | |||||||||
| Equity Value Per Share | 53.04 |
Benefits You Will Receive
- Flexible Forecast Inputs: Easily modify key assumptions (growth %, margins, WACC) to explore various scenarios.
- Industry Data: Dowlais Group plc’s financial information pre-loaded to kickstart your analysis.
- Automated DCF Outputs: The model computes Net Present Value (NPV) and intrinsic value for you.
- Customizable and Professional Design: A refined Excel model tailored to fit your valuation requirements.
- Designed for Analysts and Investors: Perfect for testing projections, validating strategies, and enhancing efficiency.
Key Features
- 🔍 Real-Life DWLL Financials: Pre-filled historical and projected data for Dowlais Group plc.
- ✏️ Fully Customizable Inputs: Adjust all critical parameters (yellow cells) such as WACC, growth %, and tax rates.
- 📊 Professional DCF Valuation: Built-in formulas calculate Dowlais Group's intrinsic value using the Discounted Cash Flow method.
- ⚡ Instant Results: Visualize Dowlais Group's valuation immediately after making changes.
- Scenario Analysis: Test and compare outcomes for various financial assumptions side-by-side.
How It Works
- Step 1: Download the Excel file.
- Step 2: Review Dowlais Group plc's (DWLL) pre-filled financial data and forecasts.
- Step 3: Adjust key inputs such as revenue growth, WACC, and tax rates (highlighted cells).
- Step 4: Observe the DCF model update in real-time as you modify the assumptions.
- Step 5: Analyze the outputs to inform your investment decisions.
Why Opt for Dowlais Group plc (DWLL) Calculator?
- Time-Efficient: Skip the hassle of building a DCF model from the ground up – it's ready for immediate use.
- Enhanced Accuracy: Trustworthy financial data and formulas minimize valuation errors.
- Completely Customizable: Adjust the model to suit your specific assumptions and forecasts.
- User-Friendly: Intuitive charts and outputs make it simple to understand the results.
- Favored by Professionals: Crafted for experts who prioritize accuracy and functionality.
Who Should Utilize This Product?
- Investors: Accurately assess the fair value of Dowlais Group plc (DWLL) before making investment choices.
- CFOs: Employ a professional-grade DCF model for financial analysis and reporting related to Dowlais Group plc (DWLL).
- Consultants: Swiftly customize the template for valuation reports tailored to clients investing in Dowlais Group plc (DWLL).
- Entrepreneurs: Acquire insights into the financial modeling practices of companies like Dowlais Group plc (DWLL).
- Educators: Utilize it as a teaching resource to illustrate valuation techniques relevant to Dowlais Group plc (DWLL).
Contents of the Template
- Preloaded DWLL Data: Historical and forecasted financial data, including revenue, EBIT, and capital expenditures.
- DCF and WACC Models: Professional-quality sheets for calculating intrinsic value and Weighted Average Cost of Capital.
- Editable Inputs: Cells highlighted in yellow to modify revenue growth, tax rates, and discount rates.
- Financial Statements: Detailed annual and quarterly financials for in-depth analysis.
- Key Ratios: Ratios assessing profitability, leverage, and efficiency for performance evaluation.
- Dashboard and Charts: Visual representations of valuation results and underlying assumptions.
Disclaimer
All information, articles, and product details provided on this website are for general informational and educational purposes only. We do not claim any ownership over, nor do we intend to infringe upon, any trademarks, copyrights, logos, brand names, or other intellectual property mentioned or depicted on this site. Such intellectual property remains the property of its respective owners, and any references here are made solely for identification or informational purposes, without implying any affiliation, endorsement, or partnership.
We make no representations or warranties, express or implied, regarding the accuracy, completeness, or suitability of any content or products presented. Nothing on this website should be construed as legal, tax, investment, financial, medical, or other professional advice. In addition, no part of this site—including articles or product references—constitutes a solicitation, recommendation, endorsement, advertisement, or offer to buy or sell any securities, franchises, or other financial instruments, particularly in jurisdictions where such activity would be unlawful.
All content is of a general nature and may not address the specific circumstances of any individual or entity. It is not a substitute for professional advice or services. Any actions you take based on the information provided here are strictly at your own risk. You accept full responsibility for any decisions or outcomes arising from your use of this website and agree to release us from any liability in connection with your use of, or reliance upon, the content or products found herein.