
|
Encore Capital Group, Inc. (ECPG) Évaluation DCF |
Entièrement Modifiable: Adapté À Vos Besoins Dans Excel Ou Sheets
Conception Professionnelle: Modèles Fiables Et Conformes Aux Normes Du Secteur
Pré-Construits Pour Une Utilisation Rapide Et Efficace
Compatible MAC/PC, entièrement débloqué
Aucune Expertise N'Est Requise; Facile À Suivre
Encore Capital Group, Inc. (ECPG) Bundle
Que vous soyez un investisseur ou un analyste, cette calculatrice DCF (ECPG) est votre ressource incontournable pour une évaluation précise. Chargé de données réelles de Encore Capital Group, Inc., vous pouvez ajuster vos prévisions et observer instantanément les effets.
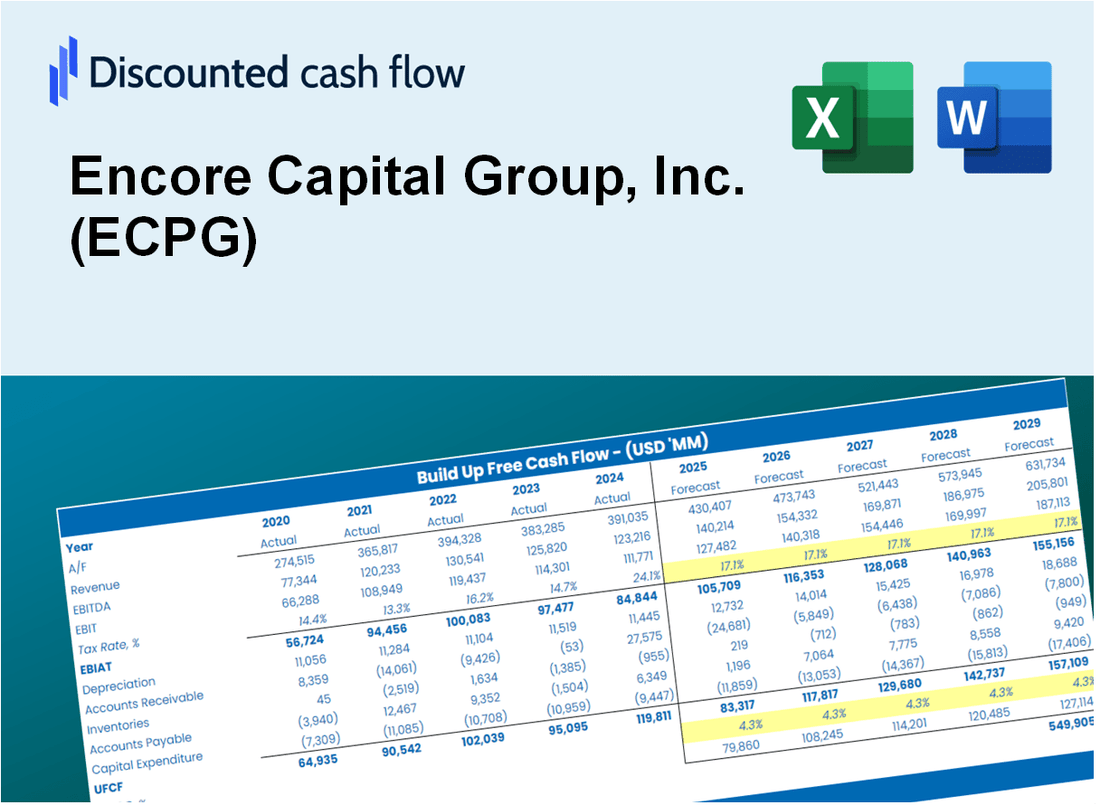
Discounted Cash Flow (DCF) - (USD MM)
| Year | AY1 2020 |
AY2 2021 |
AY3 2022 |
AY4 2023 |
AY5 2024 |
FY1 2025 |
FY2 2026 |
FY3 2027 |
FY4 2028 |
FY5 2029 |
|---|---|---|---|---|---|---|---|---|---|---|
| Revenue | 1,501.4 | 1,614.5 | 1,398.3 | 1,222.7 | 1,316.4 | 1,281.0 | 1,246.5 | 1,213.0 | 1,180.4 | 1,148.6 |
| Revenue Growth, % | 0 | 7.53 | -13.39 | -12.56 | 7.66 | -2.69 | -2.69 | -2.69 | -2.69 | -2.69 |
| EBITDA | 535.0 | 656.3 | 510.7 | 63.4 | 174.0 | 336.1 | 327.1 | 318.3 | 309.7 | 301.4 |
| EBITDA, % | 35.64 | 40.65 | 36.52 | 5.18 | 13.22 | 26.24 | 26.24 | 26.24 | 26.24 | 26.24 |
| Depreciation | 42.8 | 50.1 | 46.4 | 41.7 | 32.4 | 38.8 | 37.8 | 36.7 | 35.8 | 34.8 |
| Depreciation, % | 2.85 | 3.1 | 3.32 | 3.41 | 2.46 | 3.03 | 3.03 | 3.03 | 3.03 | 3.03 |
| EBIT | 492.3 | 606.2 | 464.3 | 21.6 | 141.6 | 297.3 | 289.3 | 281.6 | 274.0 | 266.6 |
| EBIT, % | 32.79 | 37.55 | 33.2 | 1.77 | 10.75 | 23.21 | 23.21 | 23.21 | 23.21 | 23.21 |
| Total Cash | 189.2 | 189.6 | 143.9 | 158.4 | 199.9 | 160.8 | 156.5 | 152.3 | 148.2 | 144.2 |
| Total Cash, percent | .0 | .0 | .0 | .0 | .0 | .0 | .0 | .0 | .0 | .0 |
| Account Receivables | 26.5 | 22.6 | 16.1 | 9.1 | 3,776.4 | 269.2 | 261.9 | 254.9 | 248.0 | 241.4 |
| Account Receivables, % | 1.77 | 1.4 | 1.15 | 0.74263 | 286.88 | 21.01 | 21.01 | 21.01 | 21.01 | 21.01 |
| Inventories | .0 | .0 | .0 | .0 | .0 | .0 | .0 | .0 | .0 | .0 |
| Inventories, % | 0 | 0 | 0 | 0 | 0 | 0 | 0 | 0 | 0 | 0 |
| Accounts Payable | .0 | .0 | .0 | 173.9 | 212.0 | 77.7 | 75.6 | 73.6 | 71.6 | 69.7 |
| Accounts Payable, % | 0 | 0 | 0 | 14.23 | 16.11 | 6.07 | 6.07 | 6.07 | 6.07 | 6.07 |
| Capital Expenditure | -34.6 | -33.4 | -37.2 | -51.7 | -29.0 | -34.5 | -33.6 | -32.7 | -31.8 | -30.9 |
| Capital Expenditure, % | -2.3 | -2.07 | -2.66 | -4.23 | -2.2 | -2.69 | -2.69 | -2.69 | -2.69 | -2.69 |
| Tax Rate, % | -44.72 | -44.72 | -44.72 | -44.72 | -44.72 | -44.72 | -44.72 | -44.72 | -44.72 | -44.72 |
| EBITAT | 368.6 | 487.1 | 290.5 | 24.8 | 204.9 | 248.5 | 241.8 | 235.3 | 228.9 | 222.8 |
| Depreciation | ||||||||||
| Changes in Account Receivables | ||||||||||
| Changes in Inventories | ||||||||||
| Changes in Accounts Payable | ||||||||||
| Capital Expenditure | ||||||||||
| UFCF | 350.3 | 507.7 | 306.2 | 195.7 | -3,520.9 | 3,625.6 | 251.1 | 244.4 | 237.8 | 231.4 |
| WACC, % | 6.54 | 6.82 | 5.9 | 7.84 | 7.84 | 6.99 | 6.99 | 6.99 | 6.99 | 6.99 |
| PV UFCF | ||||||||||
| SUM PV UFCF | 4,154.2 | |||||||||
| Long Term Growth Rate, % | 2.00 | |||||||||
| Free cash flow (T + 1) | 236 | |||||||||
| Terminal Value | 4,730 | |||||||||
| Present Terminal Value | 3,374 | |||||||||
| Enterprise Value | 7,529 | |||||||||
| Net Debt | 3,473 | |||||||||
| Equity Value | 4,056 | |||||||||
| Diluted Shares Outstanding, MM | 24 | |||||||||
| Equity Value Per Share | 169.88 |
What You Will Get
- Real ECPG Financial Data: Pre-filled with Encore Capital Group’s historical and projected data for precise analysis.
- Fully Editable Template: Modify key inputs like revenue growth, WACC, and EBITDA % with ease.
- Automatic Calculations: See Encore Capital Group’s intrinsic value update instantly based on your changes.
- Professional Valuation Tool: Designed for investors, analysts, and consultants seeking accurate DCF results.
- User-Friendly Design: Simple structure and clear instructions for all experience levels.
Key Features
- Pre-Loaded Data: Encore Capital Group’s historical financial statements and pre-filled forecasts.
- Fully Adjustable Inputs: Modify WACC, tax rates, revenue growth, and EBITDA margins as needed.
- Instant Results: View Encore Capital Group’s intrinsic value recalculating in real time.
- Clear Visual Outputs: Dashboard charts illustrate valuation results and essential metrics.
- Built for Accuracy: A professional tool designed for analysts, investors, and finance professionals.
How It Works
- Download: Get the pre-built Excel file featuring Encore Capital Group, Inc.'s (ECPG) financial data.
- Customize: Modify projections, including revenue growth, EBITDA %, and WACC.
- Update Automatically: The intrinsic value and NPV calculations refresh in real-time.
- Test Scenarios: Develop various forecasts and instantly compare results.
- Make Decisions: Leverage the valuation insights to inform your investment strategy.
Why Choose This Calculator for Encore Capital Group, Inc. (ECPG)?
- Designed for Experts: A sophisticated tool utilized by financial analysts, CFOs, and industry consultants.
- Accurate Financial Data: Encore Capital's historical and projected financials are preloaded for precise analysis.
- Flexible Scenario Analysis: Effortlessly simulate various forecasts and assumptions.
- Comprehensive Outputs: Automatically computes intrinsic value, NPV, and essential metrics.
- User-Friendly: Step-by-step guidance makes the process straightforward.
Who Should Use Encore Capital Group, Inc. (ECPG)?
- Investors: Gain insights into the credit management industry with a reliable investment analysis tool.
- Financial Analysts: Utilize a comprehensive financial model tailored for evaluating Encore Capital’s performance.
- Consultants: Seamlessly modify presentations and reports for clients in the financial services sector.
- Finance Enthusiasts: Explore the intricacies of debt purchasing and asset management through real-life case studies.
- Educators and Students: Leverage this resource as a practical guide in finance and investment courses.
What the Template Contains
- Pre-Filled Data: Includes Encore Capital Group’s historical financials and forecasts.
- Discounted Cash Flow Model: Editable DCF valuation model with automatic calculations.
- Weighted Average Cost of Capital (WACC): A dedicated sheet for calculating WACC based on custom inputs.
- Key Financial Ratios: Analyze Encore Capital Group’s profitability, efficiency, and leverage.
- Customizable Inputs: Edit revenue growth, margins, and tax rates with ease.
- Clear Dashboard: Charts and tables summarizing key valuation results.
Disclaimer
All information, articles, and product details provided on this website are for general informational and educational purposes only. We do not claim any ownership over, nor do we intend to infringe upon, any trademarks, copyrights, logos, brand names, or other intellectual property mentioned or depicted on this site. Such intellectual property remains the property of its respective owners, and any references here are made solely for identification or informational purposes, without implying any affiliation, endorsement, or partnership.
We make no representations or warranties, express or implied, regarding the accuracy, completeness, or suitability of any content or products presented. Nothing on this website should be construed as legal, tax, investment, financial, medical, or other professional advice. In addition, no part of this site—including articles or product references—constitutes a solicitation, recommendation, endorsement, advertisement, or offer to buy or sell any securities, franchises, or other financial instruments, particularly in jurisdictions where such activity would be unlawful.
All content is of a general nature and may not address the specific circumstances of any individual or entity. It is not a substitute for professional advice or services. Any actions you take based on the information provided here are strictly at your own risk. You accept full responsibility for any decisions or outcomes arising from your use of this website and agree to release us from any liability in connection with your use of, or reliance upon, the content or products found herein.