
|
Edenred SA (eden.pa) Valation DCF |
Entièrement Modifiable: Adapté À Vos Besoins Dans Excel Ou Sheets
Conception Professionnelle: Modèles Fiables Et Conformes Aux Normes Du Secteur
Pré-Construits Pour Une Utilisation Rapide Et Efficace
Compatible MAC/PC, entièrement débloqué
Aucune Expertise N'Est Requise; Facile À Suivre
Edenred SA (EDEN.PA) Bundle
Conçu pour la précision, notre calculatrice DCF (EdenPA) vous permet d'évaluer l'évaluation d'EdenRed SA à l'aide de données financières du monde réel, offrant une flexibilité complète pour modifier tous les paramètres essentiels pour l'amélioration des projections.
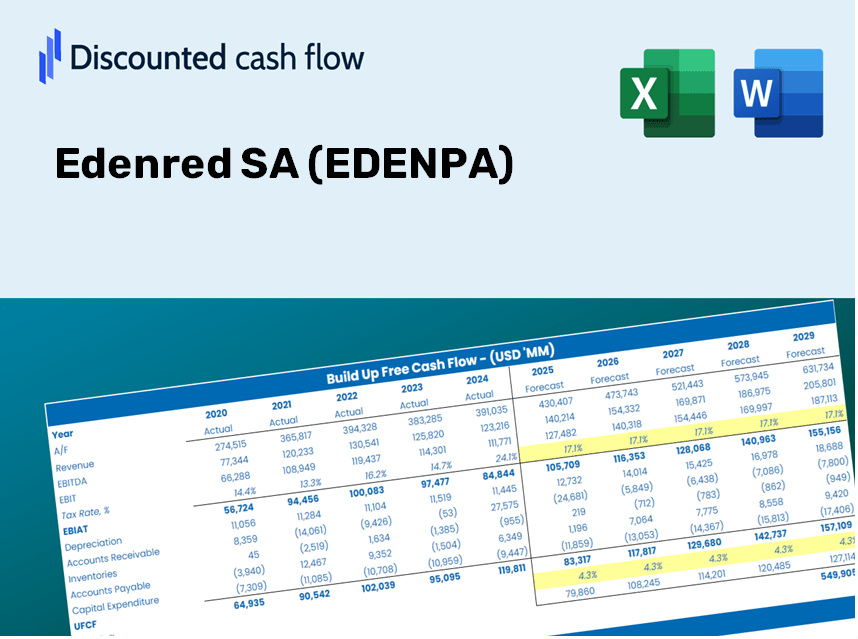
Discounted Cash Flow (DCF) - (USD MM)
| Year | AY1 2020 |
AY2 2021 |
AY3 2022 |
AY4 2023 |
AY5 2024 |
FY1 2025 |
FY2 2026 |
FY3 2027 |
FY4 2028 |
FY5 2029 |
|---|---|---|---|---|---|---|---|---|---|---|
| Revenue | 1,423.0 | 1,583.0 | 1,944.0 | 2,311.0 | 2,856.0 | 3,402.3 | 4,053.1 | 4,828.3 | 5,751.8 | 6,852.0 |
| Revenue Growth, % | 0 | 11.24 | 22.8 | 18.88 | 23.58 | 19.13 | 19.13 | 19.13 | 19.13 | 19.13 |
| EBITDA | 583.0 | 628.0 | 751.0 | 875.0 | 1,174.0 | 1,348.9 | 1,607.0 | 1,914.3 | 2,280.5 | 2,716.7 |
| EBITDA, % | 40.97 | 39.67 | 38.63 | 37.86 | 41.11 | 39.65 | 39.65 | 39.65 | 39.65 | 39.65 |
| Depreciation | 125.0 | 132.0 | 149.0 | 346.0 | 245.0 | 328.9 | 391.8 | 466.8 | 556.1 | 662.4 |
| Depreciation, % | 8.78 | 8.34 | 7.66 | 14.97 | 8.58 | 9.67 | 9.67 | 9.67 | 9.67 | 9.67 |
| EBIT | 458.0 | 496.0 | 602.0 | 529.0 | 929.0 | 1,020.0 | 1,215.1 | 1,447.6 | 1,724.4 | 2,054.3 |
| EBIT, % | 32.19 | 31.33 | 30.97 | 22.89 | 32.53 | 29.98 | 29.98 | 29.98 | 29.98 | 29.98 |
| Total Cash | 4,724.0 | 5,107.0 | 5,144.0 | 3,354.0 | 3,033.0 | 3,402.3 | 4,053.1 | 4,828.3 | 5,751.8 | 6,852.0 |
| Total Cash, percent | .0 | .0 | .0 | .0 | .0 | .0 | .0 | .0 | .0 | .0 |
| Account Receivables | 1,988.0 | 2,509.0 | 3,186.0 | 2,788.0 | 3,140.0 | 3,402.3 | 4,053.1 | 4,828.3 | 5,751.8 | 6,852.0 |
| Account Receivables, % | 139.7 | 158.5 | 163.89 | 120.64 | 109.94 | 100 | 100 | 100 | 100 | 100 |
| Inventories | 43.0 | 46.0 | 59.0 | 67.0 | 62.0 | 95.5 | 113.8 | 135.5 | 161.4 | 192.3 |
| Inventories, % | 3.02 | 2.91 | 3.03 | 2.9 | 2.17 | 2.81 | 2.81 | 2.81 | 2.81 | 2.81 |
| Accounts Payable | 669.0 | 721.0 | 1,033.0 | 1,653.0 | 1,793.0 | 1,905.3 | 2,269.8 | 2,703.9 | 3,221.1 | 3,837.2 |
| Accounts Payable, % | 47.01 | 45.55 | 53.14 | 71.53 | 62.78 | 56 | 56 | 56 | 56 | 56 |
| Capital Expenditure | -104.0 | -114.0 | -151.0 | -190.0 | -217.0 | -259.2 | -308.8 | -367.9 | -438.3 | -522.1 |
| Capital Expenditure, % | -7.31 | -7.2 | -7.77 | -8.22 | -7.6 | -7.62 | -7.62 | -7.62 | -7.62 | -7.62 |
| Tax Rate, % | 36.55 | 36.55 | 36.55 | 36.55 | 36.55 | 36.55 | 36.55 | 36.55 | 36.55 | 36.55 |
| EBITAT | 289.1 | 319.4 | 385.4 | 264.5 | 589.5 | 622.2 | 741.2 | 883.0 | 1,051.9 | 1,253.1 |
| Depreciation | ||||||||||
| Changes in Account Receivables | ||||||||||
| Changes in Inventories | ||||||||||
| Changes in Accounts Payable | ||||||||||
| Capital Expenditure | ||||||||||
| UFCF | -1,051.9 | -134.6 | 5.4 | 1,430.5 | 410.5 | 508.4 | 519.7 | 619.0 | 737.5 | 878.5 |
| WACC, % | 4.02 | 4.04 | 4.03 | 3.78 | 4.02 | 3.98 | 3.98 | 3.98 | 3.98 | 3.98 |
| PV UFCF | ||||||||||
| SUM PV UFCF | 2,874.2 | |||||||||
| Long Term Growth Rate, % | 2.00 | |||||||||
| Free cash flow (T + 1) | 896 | |||||||||
| Terminal Value | 45,334 | |||||||||
| Present Terminal Value | 37,303 | |||||||||
| Enterprise Value | 40,177 | |||||||||
| Net Debt | 2,904 | |||||||||
| Equity Value | 37,273 | |||||||||
| Diluted Shares Outstanding, MM | 253 | |||||||||
| Equity Value Per Share | 147.53 |
What You Will Receive
- Authentic EDENPA Financials: Access to both historical and projected data for precise valuation.
- Customizable Inputs: Adjust WACC, tax rates, revenue growth, and capital expenditures as needed.
- Automated Calculations: Intrinsic value and NPV are computed in real-time.
- Scenario Analysis: Evaluate various scenarios to forecast Edenred's future performance.
- User-Friendly Design: Crafted for professionals while being easy to navigate for newcomers.
Key Features
- 🔍 Real-Life EDENPA Financials: Pre-filled historical and projected data for Edenred SA.
- ✏️ Fully Customizable Inputs: Modify all essential parameters (yellow cells) such as WACC, growth %, and tax rates.
- 📊 Professional DCF Valuation: Integrated formulas to determine Edenred's intrinsic value using the Discounted Cash Flow method.
- ⚡ Instant Results: Visualize Edenred's valuation immediately after adjustments.
- Scenario Analysis: Evaluate and compare different outcomes based on various financial assumptions side-by-side.
How It Functions
- Step 1: Download the Excel file.
- Step 2: Examine Edenred SA's pre-filled financial data and projections.
- Step 3: Adjust key inputs such as revenue growth, WACC, and tax rates (highlighted cells).
- Step 4: Observe the DCF model refresh in real-time as you alter assumptions.
- Step 5: Evaluate the results and leverage them for your investment choices.
Why Choose This Calculator for Edenred SA (EDENPA)?
- All-in-One Solution: Combines Discounted Cash Flow (DCF), Weighted Average Cost of Capital (WACC), and financial ratio assessments into a single platform.
- Flexible Customization: Modify the yellow-highlighted fields to explore different financial scenarios.
- In-Depth Analysis: Automatically computes Edenred's intrinsic value and Net Present Value.
- Rich Data Integration: Comes with historical and projected data for reliable foundational analysis.
- Expert-Grade Tool: Perfect for financial analysts, investors, and business consultants focusing on (EDENPA).
Who Should Utilize This Product?
- Investors: Assess Edenred SA’s (EDENPA) valuation before making stock transactions.
- CFOs and Financial Analysts: Enhance valuation methodologies and evaluate forecasts.
- Startup Founders: Understand the valuation processes of leading public companies like Edenred SA.
- Consultants: Provide comprehensive valuation reports to clients.
- Students and Educators: Utilize real-life data to practice and instruct on valuation methods.
Contents of the Template
- Preloaded EDENPA Data: Historical and projected financial metrics, including revenue, EBIT, and capital expenditures.
- DCF and WACC Models: Advanced sheets designed for calculating intrinsic value and the Weighted Average Cost of Capital.
- Editable Inputs: Yellow-highlighted cells to modify parameters such as revenue growth, tax rates, and discount rates.
- Financial Statements: Detailed annual and quarterly financial reports for thorough analysis.
- Key Ratios: Metrics for assessing profitability, leverage, and operational efficiency.
- Dashboard and Charts: Visual representations of valuation results and underlying assumptions.
Disclaimer
All information, articles, and product details provided on this website are for general informational and educational purposes only. We do not claim any ownership over, nor do we intend to infringe upon, any trademarks, copyrights, logos, brand names, or other intellectual property mentioned or depicted on this site. Such intellectual property remains the property of its respective owners, and any references here are made solely for identification or informational purposes, without implying any affiliation, endorsement, or partnership.
We make no representations or warranties, express or implied, regarding the accuracy, completeness, or suitability of any content or products presented. Nothing on this website should be construed as legal, tax, investment, financial, medical, or other professional advice. In addition, no part of this site—including articles or product references—constitutes a solicitation, recommendation, endorsement, advertisement, or offer to buy or sell any securities, franchises, or other financial instruments, particularly in jurisdictions where such activity would be unlawful.
All content is of a general nature and may not address the specific circumstances of any individual or entity. It is not a substitute for professional advice or services. Any actions you take based on the information provided here are strictly at your own risk. You accept full responsibility for any decisions or outcomes arising from your use of this website and agree to release us from any liability in connection with your use of, or reliance upon, the content or products found herein.