
|
EDP Renováveis, S.A. (EDPR.LS) Évaluation DCF |
Entièrement Modifiable: Adapté À Vos Besoins Dans Excel Ou Sheets
Conception Professionnelle: Modèles Fiables Et Conformes Aux Normes Du Secteur
Pré-Construits Pour Une Utilisation Rapide Et Efficace
Compatible MAC/PC, entièrement débloqué
Aucune Expertise N'Est Requise; Facile À Suivre
EDP Renováveis, S.A. (EDPR.LS) Bundle
Améliorez vos stratégies d'investissement avec la calculatrice DCF (EDPRLS)! Explorez l'authentique EDP Renováveis, S.A. Financials, ajustez les prédictions et les dépenses de croissance et observez instantanément comment ces changements affectent la valeur intrinsèque de (EDPRL).
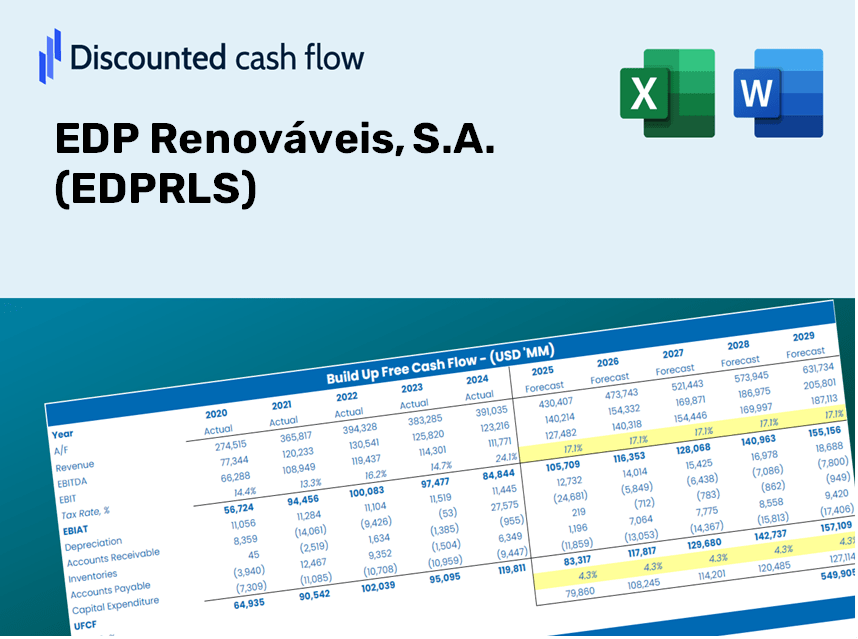
Discounted Cash Flow (DCF) - (USD MM)
| Year | AY1 2020 |
AY2 2021 |
AY3 2022 |
AY4 2023 |
AY5 2024 |
FY1 2025 |
FY2 2026 |
FY3 2027 |
FY4 2028 |
FY5 2029 |
|---|---|---|---|---|---|---|---|---|---|---|
| Revenue | 1,723.9 | 1,760.5 | 2,378.4 | 2,532.9 | 2,686.6 | 3,021.0 | 3,397.0 | 3,819.9 | 4,295.3 | 4,829.9 |
| Revenue Growth, % | 0 | 2.12 | 35.09 | 6.49 | 6.07 | 12.45 | 12.45 | 12.45 | 12.45 | 12.45 |
| EBITDA | 1,543.4 | 1,638.4 | 1,829.5 | 941.1 | 1,476.0 | 2,124.4 | 2,388.8 | 2,686.2 | 3,020.5 | 3,396.4 |
| EBITDA, % | 89.53 | 93.06 | 76.92 | 37.16 | 54.94 | 70.32 | 70.32 | 70.32 | 70.32 | 70.32 |
| Depreciation | 621.6 | 626.4 | 722.0 | 723.3 | 1,428.7 | 1,110.1 | 1,248.3 | 1,403.6 | 1,578.3 | 1,774.8 |
| Depreciation, % | 36.05 | 35.58 | 30.36 | 28.56 | 53.18 | 36.75 | 36.75 | 36.75 | 36.75 | 36.75 |
| EBIT | 921.8 | 1,011.9 | 1,107.4 | 217.9 | 47.3 | 1,014.3 | 1,140.6 | 1,282.5 | 1,442.2 | 1,621.7 |
| EBIT, % | 53.47 | 57.48 | 46.56 | 8.6 | 1.76 | 33.58 | 33.58 | 33.58 | 33.58 | 33.58 |
| Total Cash | 483.4 | 1,003.6 | 1,170.4 | 1,368.9 | 1,216.2 | 1,411.2 | 1,586.9 | 1,784.4 | 2,006.5 | 2,256.2 |
| Total Cash, percent | .0 | .0 | .0 | .0 | .0 | .0 | .0 | .0 | .0 | .0 |
| Account Receivables | 786.1 | 767.3 | 1,125.7 | 843.3 | 1,109.8 | 1,275.6 | 1,434.4 | 1,612.9 | 1,813.6 | 2,039.4 |
| Account Receivables, % | 45.6 | 43.58 | 47.33 | 33.29 | 41.31 | 42.22 | 42.22 | 42.22 | 42.22 | 42.22 |
| Inventories | 59.9 | 219.8 | 297.7 | 290.0 | 275.9 | 303.3 | 341.0 | 383.5 | 431.2 | 484.8 |
| Inventories, % | 3.47 | 12.49 | 12.51 | 11.45 | 10.27 | 10.04 | 10.04 | 10.04 | 10.04 | 10.04 |
| Accounts Payable | 1,234.2 | 1,510.6 | 2,635.7 | 245.3 | 1,990.6 | 2,061.4 | 2,318.0 | 2,606.5 | 2,930.9 | 3,295.7 |
| Accounts Payable, % | 71.59 | 85.81 | 110.82 | 9.68 | 74.09 | 68.24 | 68.24 | 68.24 | 68.24 | 68.24 |
| Capital Expenditure | -1,547.3 | -2,372.1 | -2,349.6 | -4,113.8 | -4,179.3 | -2,951.8 | -3,319.2 | -3,732.3 | -4,196.9 | -4,719.2 |
| Capital Expenditure, % | -89.75 | -134.74 | -98.79 | -162.42 | -155.56 | -97.71 | -97.71 | -97.71 | -97.71 | -97.71 |
| Tax Rate, % | -45.62 | -45.62 | -45.62 | -45.62 | -45.62 | -45.62 | -45.62 | -45.62 | -45.62 | -45.62 |
| EBITAT | 666.2 | 734.8 | 709.1 | 119.9 | 68.8 | 738.4 | 830.3 | 933.6 | 1,049.8 | 1,180.5 |
| Depreciation | ||||||||||
| Changes in Account Receivables | ||||||||||
| Changes in Inventories | ||||||||||
| Changes in Accounts Payable | ||||||||||
| Capital Expenditure | ||||||||||
| UFCF | 128.7 | -875.5 | -229.7 | -5,370.9 | -1,188.8 | -1,225.7 | -1,180.6 | -1,327.6 | -1,492.8 | -1,678.6 |
| WACC, % | 5.47 | 5.47 | 5.34 | 5.2 | 5.9 | 5.47 | 5.47 | 5.47 | 5.47 | 5.47 |
| PV UFCF | ||||||||||
| SUM PV UFCF | -5,846.8 | |||||||||
| Long Term Growth Rate, % | 3.00 | |||||||||
| Free cash flow (T + 1) | -1,729 | |||||||||
| Terminal Value | -69,875 | |||||||||
| Present Terminal Value | -53,529 | |||||||||
| Enterprise Value | -59,375 | |||||||||
| Net Debt | 8,319 | |||||||||
| Equity Value | -67,694 | |||||||||
| Diluted Shares Outstanding, MM | 1,035 | |||||||||
| Equity Value Per Share | -65.43 |
Benefits of Choosing EDPRLS
- Authentic EDPRLS Data: Preloaded financials – covering everything from revenue to EBIT – grounded in real and projected figures.
- Comprehensive Customization: Modify all essential parameters (yellow cells) such as WACC, growth %, and tax rates.
- Immediate Valuation Adjustments: Automated recalculations to assess the effect of changes on EDPRLS’s fair value.
- Flexible Excel Template: Designed for quick modifications, scenario analysis, and in-depth forecasts.
- Efficient and Reliable: Avoid the hassle of creating models from scratch while ensuring accuracy and adaptability.
Key Features
- Real-Time EDPRLS Data: Pre-filled with EDP Renováveis’ historical financial information and forward-looking forecasts.
- Fully Customizable Parameters: Modify revenue growth rates, profit margins, WACC, tax percentages, and capital investments.
- Dynamic Valuation Framework: Automatically refreshes Net Present Value (NPV) and intrinsic value based on your customized inputs.
- Scenario Analysis: Develop multiple forecasting scenarios to evaluate various valuation possibilities.
- User-Friendly Interface: Intuitive and organized, suitable for both experienced professionals and newcomers.
How It Functions
- Step 1: Download the ready-to-use Excel template featuring EDP Renováveis (EDPRLS) data.
- Step 2: Review the pre-populated sheets to familiarize yourself with essential metrics.
- Step 3: Modify forecasts and assumptions in the editable yellow cells (WACC, growth, margins).
- Step 4: Instantly access updated results, which include the intrinsic value of EDP Renováveis (EDPRLS).
- Step 5: Utilize the results to make informed investment choices or create comprehensive reports.
Why Opt for This Calculator?
- Reliable Data: Accurate financial information for EDP Renováveis, S.A. (EDPRLS) guarantees trustworthy valuation outcomes.
- Customizable Options: Modify essential inputs such as growth rates, WACC, and tax rates to align with your forecasts.
- Time-Efficient: Built-in calculations save you from starting from the ground up.
- Professional-Quality Tool: Tailored for investors, analysts, and consultants in the renewable energy sector.
- User-Friendly Design: An intuitive layout and clear, step-by-step guidance make it accessible for everyone.
Who Should Use This Product?
- Investors: Evaluate the fair value of EDP Renováveis, S.A. (EDPRLS) for informed investment choices.
- CFOs: Utilize a professional-grade DCF model for comprehensive financial reporting and analysis.
- Consultants: Easily customize the template for client valuation reports.
- Entrepreneurs: Discover financial modeling techniques employed by leading renewable energy firms.
- Educators: Implement it as a teaching resource to illustrate valuation methods.
What the Template Contains
- Pre-Filled DCF Model: EDP Renováveis’ financial data preloaded for immediate use.
- WACC Calculator: Comprehensive calculations for Weighted Average Cost of Capital.
- Financial Ratios: Assess EDP Renováveis’ profitability, leverage, and efficiency.
- Editable Inputs: Adjust assumptions like growth, margins, and CAPEX to suit your scenarios.
- Financial Statements: Annual and quarterly reports to facilitate detailed analysis.
- Interactive Dashboard: Effortlessly visualize key valuation metrics and results.
Disclaimer
All information, articles, and product details provided on this website are for general informational and educational purposes only. We do not claim any ownership over, nor do we intend to infringe upon, any trademarks, copyrights, logos, brand names, or other intellectual property mentioned or depicted on this site. Such intellectual property remains the property of its respective owners, and any references here are made solely for identification or informational purposes, without implying any affiliation, endorsement, or partnership.
We make no representations or warranties, express or implied, regarding the accuracy, completeness, or suitability of any content or products presented. Nothing on this website should be construed as legal, tax, investment, financial, medical, or other professional advice. In addition, no part of this site—including articles or product references—constitutes a solicitation, recommendation, endorsement, advertisement, or offer to buy or sell any securities, franchises, or other financial instruments, particularly in jurisdictions where such activity would be unlawful.
All content is of a general nature and may not address the specific circumstances of any individual or entity. It is not a substitute for professional advice or services. Any actions you take based on the information provided here are strictly at your own risk. You accept full responsibility for any decisions or outcomes arising from your use of this website and agree to release us from any liability in connection with your use of, or reliance upon, the content or products found herein.