
|
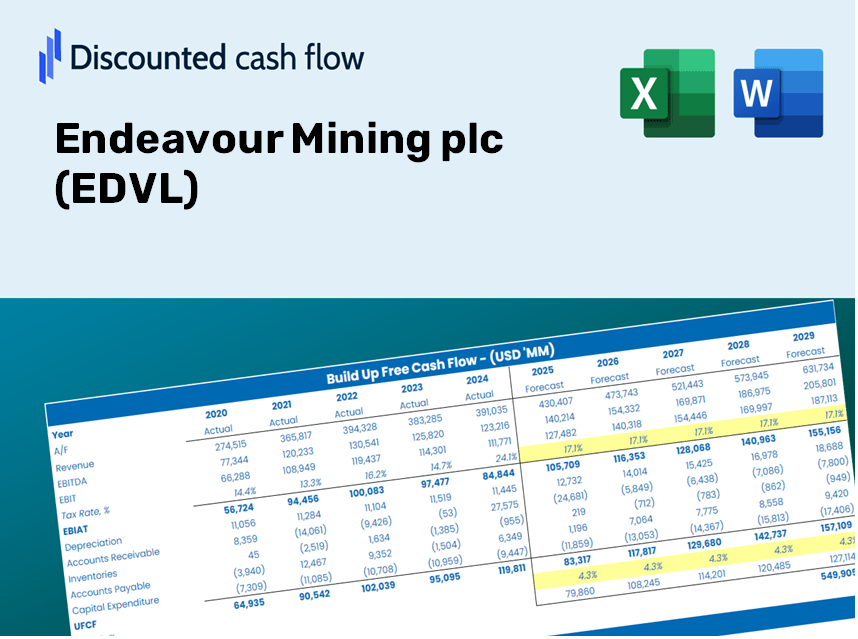
Endeavour Mining Plc (EDV.L) Évaluation DCF |
Entièrement Modifiable: Adapté À Vos Besoins Dans Excel Ou Sheets
Conception Professionnelle: Modèles Fiables Et Conformes Aux Normes Du Secteur
Pré-Construits Pour Une Utilisation Rapide Et Efficace
Compatible MAC/PC, entièrement débloqué
Aucune Expertise N'Est Requise; Facile À Suivre
Endeavour Mining plc (EDV.L) Bundle
Conçu pour la précision, notre calculatrice DCF (EDVL) vous permet d'évaluer l'évaluation des plc miniers de l'effort en utilisant des données financières réelles, offrant une flexibilité complète pour modifier tous les paramètres essentiels pour des projections améliorées.
Discounted Cash Flow (DCF) - (USD MM)
| Year | AY1 2020 |
AY2 2021 |
AY3 2022 |
AY4 2023 |
AY5 2024 |
FY1 2025 |
FY2 2026 |
FY3 2027 |
FY4 2028 |
FY5 2029 |
|---|---|---|---|---|---|---|---|---|---|---|
| Revenue | 1,083.0 | 2,009.2 | 1,573.4 | 1,608.1 | 2,035.0 | 2,506.0 | 3,086.0 | 3,800.3 | 4,679.9 | 5,763.0 |
| Revenue Growth, % | 0 | 85.53 | -21.69 | 2.2 | 26.54 | 23.15 | 23.15 | 23.15 | 23.15 | 23.15 |
| EBITDA | 397.5 | 868.0 | 911.8 | 657.6 | 652.4 | 1,056.5 | 1,301.1 | 1,602.2 | 1,973.1 | 2,429.8 |
| EBITDA, % | 36.7 | 43.2 | 57.95 | 40.89 | 32.06 | 42.16 | 42.16 | 42.16 | 42.16 | 42.16 |
| Depreciation | 198.6 | 493.3 | 486.0 | 412.4 | 493.6 | 619.9 | 763.4 | 940.1 | 1,157.7 | 1,425.6 |
| Depreciation, % | 18.34 | 24.55 | 30.89 | 25.65 | 24.26 | 24.74 | 24.74 | 24.74 | 24.74 | 24.74 |
| EBIT | 198.9 | 374.7 | 425.8 | 245.2 | 158.8 | 436.6 | 537.7 | 662.2 | 815.4 | 1,004.2 |
| EBIT, % | 18.36 | 18.65 | 27.06 | 15.25 | 7.8 | 17.42 | 17.42 | 17.42 | 17.42 | 17.42 |
| Total Cash | 490.5 | 689.1 | 731.8 | 393.3 | 318.3 | 833.0 | 1,025.8 | 1,263.2 | 1,555.6 | 1,915.6 |
| Total Cash, percent | .0 | .0 | .0 | .0 | .0 | .0 | .0 | .0 | .0 | .0 |
| Account Receivables | 40.2 | 6.5 | 16.7 | 127.3 | 51.2 | 77.8 | 95.8 | 118.0 | 145.3 | 179.0 |
| Account Receivables, % | 3.71 | 0.3255 | 1.06 | 7.92 | 2.52 | 3.11 | 3.11 | 3.11 | 3.11 | 3.11 |
| Inventories | 144.5 | 236.7 | 243.9 | 171.0 | 258.0 | 320.4 | 394.6 | 486.0 | 598.4 | 736.9 |
| Inventories, % | 13.34 | 11.78 | 15.5 | 10.64 | 12.68 | 12.79 | 12.79 | 12.79 | 12.79 | 12.79 |
| Accounts Payable | 146.7 | 188.4 | 191.9 | 213.6 | 251.0 | 304.4 | 374.8 | 461.6 | 568.4 | 700.0 |
| Accounts Payable, % | 13.55 | 9.38 | 12.19 | 13.28 | 12.33 | 12.15 | 12.15 | 12.15 | 12.15 | 12.15 |
| Capital Expenditure | -183.5 | -397.3 | -394.2 | -579.9 | -521.5 | -618.8 | -762.0 | -938.3 | -1,155.5 | -1,423.0 |
| Capital Expenditure, % | -16.94 | -19.78 | -25.05 | -36.06 | -25.63 | -24.69 | -24.69 | -24.69 | -24.69 | -24.69 |
| Tax Rate, % | 363.56 | 363.56 | 363.56 | 363.56 | 363.56 | 363.56 | 363.56 | 363.56 | 363.56 | 363.56 |
| EBITAT | 66.1 | 180.3 | -48.1 | -202.0 | -418.5 | 71.0 | 87.5 | 107.7 | 132.7 | 163.4 |
| Depreciation | ||||||||||
| Changes in Account Receivables | ||||||||||
| Changes in Inventories | ||||||||||
| Changes in Accounts Payable | ||||||||||
| Capital Expenditure | ||||||||||
| UFCF | 43.3 | 259.3 | 29.9 | -385.5 | -419.8 | 36.5 | 67.2 | 82.7 | 101.8 | 125.4 |
| WACC, % | 6.89 | 7.01 | 6.62 | 6.62 | 6.62 | 6.75 | 6.75 | 6.75 | 6.75 | 6.75 |
| PV UFCF | ||||||||||
| SUM PV UFCF | 329.9 | |||||||||
| Long Term Growth Rate, % | 2.00 | |||||||||
| Free cash flow (T + 1) | 128 | |||||||||
| Terminal Value | 2,690 | |||||||||
| Present Terminal Value | 1,940 | |||||||||
| Enterprise Value | 2,270 | |||||||||
| Net Debt | 591 | |||||||||
| Equity Value | 1,679 | |||||||||
| Diluted Shares Outstanding, MM | 245 | |||||||||
| Equity Value Per Share | 686.00 |
What You Will Receive
- Genuine EDVL Financial Data: Pre-loaded with Endeavour Mining's historical and forecasted data for precise analysis.
- Completely Customizable Template: Easily adjust essential inputs such as revenue growth, WACC, and EBITDA %.
- Instant Calculations: Watch as Endeavour Mining's intrinsic value updates in real-time with your modifications.
- Expert Valuation Tool: Tailored for investors, analysts, and consultants looking for accurate DCF outcomes.
- Intuitive Design: Straightforward layout and clear instructions suitable for all skill levels.
Key Features
- Comprehensive Historical Data: Access to Endeavour Mining plc's (EDVL) past financial statements and pre-filled projections.
- Customizable Parameters: Adjust WACC, tax rates, revenue growth, and EBITDA margins to suit your analysis.
- Real-Time Valuation: Watch as the intrinsic value of Endeavour Mining plc (EDVL) updates instantly.
- Intuitive Visualizations: Engaging dashboard charts showcase valuation outcomes and essential metrics.
- Designed for Precision: A sophisticated tool tailored for analysts, investors, and finance professionals.
How It Works
- Step 1: Download the Excel spreadsheet.
- Step 2: Examine the pre-filled financial data and projections for Endeavour Mining plc (EDVL).
- Step 3: Adjust key inputs such as revenue growth, WACC, and tax rates (highlighted cells).
- Step 4: Observe the DCF model update in real-time as you modify the assumptions.
- Step 5: Evaluate the outputs and leverage the findings for your investment strategies.
Why Choose This Calculator for Endeavour Mining plc (EDVL)?
- User-Friendly Interface: Crafted to cater to both new users and seasoned professionals.
- Customizable Assumptions: Adjust inputs effortlessly to suit your analytical needs.
- Real-Time Updates: Observe immediate changes in Endeavour Mining’s valuation as you modify inputs.
- Pre-Loaded Data: Comes equipped with Endeavour Mining’s actual financial metrics for swift evaluations.
- Relied Upon by Experts: Favored by investors and analysts for making well-informed decisions.
Who Can Benefit from This Product?
- Institutional Investors: Construct comprehensive and dependable valuation models for investment analysis.
- Corporate Finance Departments: Evaluate valuation scenarios to inform strategic decisions.
- Consultants and Financial Advisors: Deliver precise valuation insights for Endeavour Mining plc (EDVL) to clients.
- Students and Instructors: Utilize real-world data to enhance skills in financial modeling and education.
- Mining Industry Enthusiasts: Gain insights into how companies like Endeavour Mining plc (EDVL) are valued in the market.
Contents of the Template
- Comprehensive DCF Model: An editable template featuring detailed valuation calculations.
- Real-World Data: Endeavour Mining’s historical and projected financials preloaded for insightful analysis.
- Customizable Parameters: Modify WACC, growth rates, and tax assumptions to explore different scenarios.
- Financial Statements: Complete annual and quarterly breakdowns for enhanced insights.
- Key Ratios: Integrated analysis for profitability, efficiency, and leverage metrics.
- Dashboard with Visual Outputs: Charts and tables providing clear and actionable results.
Disclaimer
All information, articles, and product details provided on this website are for general informational and educational purposes only. We do not claim any ownership over, nor do we intend to infringe upon, any trademarks, copyrights, logos, brand names, or other intellectual property mentioned or depicted on this site. Such intellectual property remains the property of its respective owners, and any references here are made solely for identification or informational purposes, without implying any affiliation, endorsement, or partnership.
We make no representations or warranties, express or implied, regarding the accuracy, completeness, or suitability of any content or products presented. Nothing on this website should be construed as legal, tax, investment, financial, medical, or other professional advice. In addition, no part of this site—including articles or product references—constitutes a solicitation, recommendation, endorsement, advertisement, or offer to buy or sell any securities, franchises, or other financial instruments, particularly in jurisdictions where such activity would be unlawful.
All content is of a general nature and may not address the specific circumstances of any individual or entity. It is not a substitute for professional advice or services. Any actions you take based on the information provided here are strictly at your own risk. You accept full responsibility for any decisions or outcomes arising from your use of this website and agree to release us from any liability in connection with your use of, or reliance upon, the content or products found herein.