
|
Emerson Electric Co. (EMR) Évaluation DCF |
Entièrement Modifiable: Adapté À Vos Besoins Dans Excel Ou Sheets
Conception Professionnelle: Modèles Fiables Et Conformes Aux Normes Du Secteur
Pré-Construits Pour Une Utilisation Rapide Et Efficace
Compatible MAC/PC, entièrement débloqué
Aucune Expertise N'Est Requise; Facile À Suivre
Emerson Electric Co. (EMR) Bundle
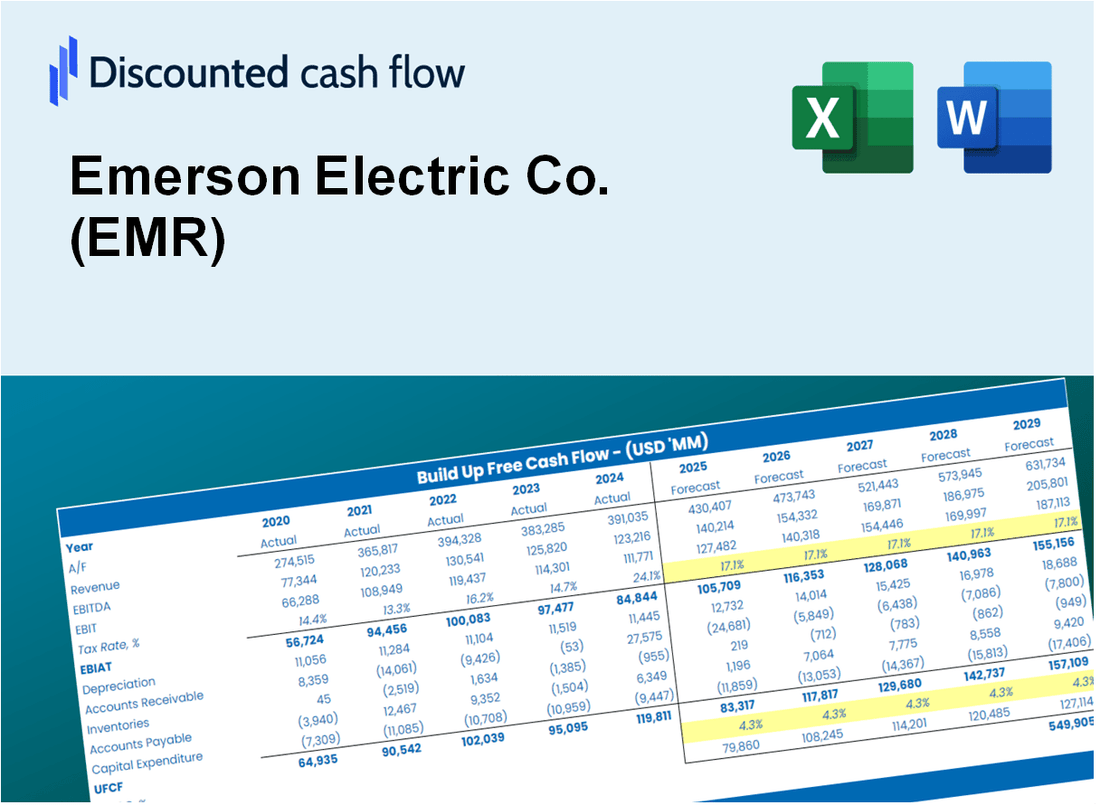
Explorez les perspectives financières d'Emerson Electric Co. (EMR) avec notre calculatrice DCF conviviale! Entrez vos hypothèses concernant la croissance, les marges et les dépenses pour calculer la valeur intrinsèque d'Emerson Electric Co. (EMR) et façonner votre stratégie d'investissement.
Discounted Cash Flow (DCF) - (USD MM)
| Year | AY1 2021 |
AY2 2022 |
AY3 2023 |
AY4 2024 |
AY5 2025 |
FY1 2026 |
FY2 2027 |
FY3 2028 |
FY4 2029 |
FY5 2030 |
|---|---|---|---|---|---|---|---|---|---|---|
| Revenue | 12,932.0 | 13,804.0 | 15,165.0 | 17,492.0 | 18,016.0 | 19,589.8 | 21,301.1 | 23,161.9 | 25,185.3 | 27,385.3 |
| Revenue Growth, % | 0 | 6.74 | 9.86 | 15.34 | 3 | 8.74 | 8.74 | 8.74 | 8.74 | 8.74 |
| EBITDA | 2,689.0 | 3,502.0 | 4,215.0 | 4,032.0 | 4,860.0 | 4,857.6 | 5,282.0 | 5,743.4 | 6,245.1 | 6,790.7 |
| EBITDA, % | 20.79 | 25.37 | 27.79 | 23.05 | 26.98 | 24.8 | 24.8 | 24.8 | 24.8 | 24.8 |
| Depreciation | 762.0 | 842.0 | 1,051.0 | 1,689.0 | 1,689.0 | 1,487.0 | 1,616.9 | 1,758.1 | 1,911.7 | 2,078.7 |
| Depreciation, % | 5.89 | 6.1 | 6.93 | 9.66 | 9.38 | 7.59 | 7.59 | 7.59 | 7.59 | 7.59 |
| EBIT | 1,927.0 | 2,660.0 | 3,164.0 | 2,343.0 | 3,171.0 | 3,370.6 | 3,665.1 | 3,985.3 | 4,333.4 | 4,711.9 |
| EBIT, % | 14.9 | 19.27 | 20.86 | 13.39 | 17.6 | 17.21 | 17.21 | 17.21 | 17.21 | 17.21 |
| Total Cash | 2,354.0 | 1,804.0 | 8,051.0 | 3,588.0 | 1,544.0 | 4,444.7 | 4,832.9 | 5,255.1 | 5,714.2 | 6,213.4 |
| Total Cash, percent | .0 | .0 | .0 | .0 | .0 | .0 | .0 | .0 | .0 | .0 |
| Account Receivables | 2,971.0 | 2,261.0 | 2,518.0 | 2,927.0 | 3,101.0 | 3,522.4 | 3,830.1 | 4,164.7 | 4,528.5 | 4,924.1 |
| Account Receivables, % | 22.97 | 16.38 | 16.6 | 16.73 | 17.21 | 17.98 | 17.98 | 17.98 | 17.98 | 17.98 |
| Inventories | 2,050.0 | 1,742.0 | 2,006.0 | 2,180.0 | 2,213.0 | 2,603.3 | 2,830.7 | 3,078.0 | 3,346.9 | 3,639.3 |
| Inventories, % | 15.85 | 12.62 | 13.23 | 12.46 | 12.28 | 13.29 | 13.29 | 13.29 | 13.29 | 13.29 |
| Accounts Payable | 2,108.0 | 1,276.0 | 1,275.0 | 1,335.0 | 1,384.0 | 1,930.2 | 2,098.8 | 2,282.2 | 2,481.6 | 2,698.3 |
| Accounts Payable, % | 16.3 | 9.24 | 8.41 | 7.63 | 7.68 | 9.85 | 9.85 | 9.85 | 9.85 | 9.85 |
| Capital Expenditure | -581.0 | -531.0 | -363.0 | -419.0 | -431.0 | -608.1 | -661.2 | -719.0 | -781.8 | -850.1 |
| Capital Expenditure, % | -4.49 | -3.85 | -2.39 | -2.4 | -2.39 | -3.1 | -3.1 | -3.1 | -3.1 | -3.1 |
| Tax Rate, % | 21.85 | 21.85 | 21.85 | 21.85 | 21.85 | 21.85 | 21.85 | 21.85 | 21.85 | 21.85 |
| EBITAT | 2,518.7 | 3,533.9 | 14,407.5 | 2,282.7 | 2,478.2 | 3,206.0 | 3,486.1 | 3,790.6 | 4,121.7 | 4,481.8 |
| Depreciation | ||||||||||
| Changes in Account Receivables | ||||||||||
| Changes in Inventories | ||||||||||
| Changes in Accounts Payable | ||||||||||
| Capital Expenditure | ||||||||||
| UFCF | -213.3 | 4,030.9 | 14,573.5 | 3,029.7 | 3,578.2 | 3,819.4 | 4,075.2 | 4,431.2 | 4,818.3 | 5,239.3 |
| WACC, % | 8.7 | 8.7 | 8.7 | 8.68 | 8.57 | 8.67 | 8.67 | 8.67 | 8.67 | 8.67 |
| PV UFCF | ||||||||||
| SUM PV UFCF | 17,332.1 | |||||||||
| Long Term Growth Rate, % | 3.00 | |||||||||
| Free cash flow (T + 1) | 5,396 | |||||||||
| Terminal Value | 95,217 | |||||||||
| Present Terminal Value | 62,837 | |||||||||
| Enterprise Value | 80,169 | |||||||||
| Net Debt | 12,215 | |||||||||
| Equity Value | 67,954 | |||||||||
| Diluted Shares Outstanding, MM | 567 | |||||||||
| Equity Value Per Share | 119.91 |
What You Will Receive
- Customizable Excel Template: A fully adjustable Excel-based DCF Calculator featuring pre-filled real EMR financials.
- Authentic Data: Historical figures and future projections (highlighted in the yellow cells).
- Forecasting Flexibility: Adjust forecast parameters such as revenue growth, EBITDA %, and WACC.
- Instant Calculations: Quickly observe how your inputs affect Emerson's valuation.
- Professional Resource: Designed for investors, CFOs, consultants, and financial analysts.
- User-Friendly Interface: Organized for clarity and simplicity, complete with step-by-step guidance.
Key Features
- 🔍 Real-Life EMR Financials: Pre-filled historical and projected data for Emerson Electric Co.
- ✏️ Fully Customizable Inputs: Adjust all critical parameters (yellow cells) like WACC, growth %, and tax rates.
- 📊 Professional DCF Valuation: Built-in formulas calculate Emerson’s intrinsic value using the Discounted Cash Flow method.
- ⚡ Instant Results: Visualize Emerson’s valuation instantly after making changes.
- Scenario Analysis: Test and compare outcomes for various financial assumptions side-by-side.
How It Works
- Step 1: Download the Excel file.
- Step 2: Review pre-entered Emerson Electric Co. (EMR) data (historical and projected).
- Step 3: Adjust key assumptions (yellow cells) based on your analysis.
- Step 4: View automatic recalculations for Emerson Electric Co. (EMR)’s intrinsic value.
- Step 5: Use the outputs for investment decisions or reporting.
Why Choose the Emerson Electric Co. (EMR) Calculator?
- Accuracy: Leverages real Emerson financials for precise data.
- Flexibility: Allows users to easily test and adjust inputs as needed.
- Time-Saving: Eliminate the complexity of creating a DCF model from the ground up.
- Professional-Grade: Crafted with the expertise and usability expected at the CFO level.
- User-Friendly: Intuitive design ensures accessibility for users without extensive financial modeling skills.
Who Should Use This Product?
- Professional Investors: Develop comprehensive and trustworthy valuation models for portfolio evaluation.
- Corporate Finance Teams: Assess valuation scenarios to inform strategic decision-making.
- Consultants and Advisors: Deliver precise valuation insights for Emerson Electric Co. (EMR) to clients.
- Students and Educators: Utilize real-world data to enhance learning and practice in financial modeling.
- Tech Enthusiasts: Gain insights into how industrial companies like Emerson Electric Co. (EMR) are valued in the marketplace.
What the Template Contains
- Historical Data: Includes Emerson Electric Co.’s (EMR) past financials and baseline forecasts.
- DCF and Levered DCF Models: Detailed templates to calculate Emerson Electric Co.’s (EMR) intrinsic value.
- WACC Sheet: Pre-built calculations for Weighted Average Cost of Capital.
- Editable Inputs: Modify key drivers like growth rates, EBITDA %, and CAPEX assumptions.
- Quarterly and Annual Statements: A complete breakdown of Emerson Electric Co.’s (EMR) financials.
- Interactive Dashboard: Visualize valuation results and projections dynamically.
Disclaimer
All information, articles, and product details provided on this website are for general informational and educational purposes only. We do not claim any ownership over, nor do we intend to infringe upon, any trademarks, copyrights, logos, brand names, or other intellectual property mentioned or depicted on this site. Such intellectual property remains the property of its respective owners, and any references here are made solely for identification or informational purposes, without implying any affiliation, endorsement, or partnership.
We make no representations or warranties, express or implied, regarding the accuracy, completeness, or suitability of any content or products presented. Nothing on this website should be construed as legal, tax, investment, financial, medical, or other professional advice. In addition, no part of this site—including articles or product references—constitutes a solicitation, recommendation, endorsement, advertisement, or offer to buy or sell any securities, franchises, or other financial instruments, particularly in jurisdictions where such activity would be unlawful.
All content is of a general nature and may not address the specific circumstances of any individual or entity. It is not a substitute for professional advice or services. Any actions you take based on the information provided here are strictly at your own risk. You accept full responsibility for any decisions or outcomes arising from your use of this website and agree to release us from any liability in connection with your use of, or reliance upon, the content or products found herein.