
|
Energean Plc (Enog.L) Valation DCF |
Entièrement Modifiable: Adapté À Vos Besoins Dans Excel Ou Sheets
Conception Professionnelle: Modèles Fiables Et Conformes Aux Normes Du Secteur
Pré-Construits Pour Une Utilisation Rapide Et Efficace
Compatible MAC/PC, entièrement débloqué
Aucune Expertise N'Est Requise; Facile À Suivre
Energean plc (ENOG.L) Bundle
Évaluez les perspectives financières d'Energean PLC avec une précision experte! Cette calculatrice (ENOGL) DCF est équipée de données financières pré-remplies et vous offre la liberté totale de modifier la croissance des revenus, le WACC, les marges bénéficiaires et d'autres hypothèses essentielles pour s'aligner sur vos prévisions.
What You Will Receive
- Customizable Input Options: Effortlessly adjust variables (growth %, margins, WACC) to explore various scenarios.
- Comprehensive Market Data: Energean plc’s financial metrics provided to enhance your analysis.
- Automated DCF Calculations: The template computes Net Present Value (NPV) and intrinsic value automatically for you.
- Professional and Tailored Design: A refined Excel model that meets your specific valuation requirements.
- Designed for Analysts and Investors: Perfect for evaluating projections, confirming strategies, and optimizing your workflow.
Key Features
- Accurate Energean Financial Data: Gain access to reliable historical records and future forecasts.
- Adjustable Forecast Parameters: Modify highlighted fields such as WACC, growth rates, and profit margins.
- Real-time Calculations: Instant updates to DCF, Net Present Value (NPV), and cash flow evaluations.
- User-Friendly Dashboard: Intuitive charts and summaries for an easy visualization of your valuation outputs.
- Designed for All Skill Levels: A straightforward, user-friendly format tailored for investors, CFOs, and consultants.
How It Functions
- Download: Obtain the ready-to-use Excel file containing Energean plc's (ENOGL) financial data.
- Customize: Tailor forecasts such as revenue growth, EBITDA %, and WACC to your preferences.
- Update Automatically: Benefit from real-time updates on intrinsic value and NPV calculations.
- Test Scenarios: Generate various projections and instantly compare the results.
- Make Decisions: Leverage the valuation insights to inform your investment strategy.
Why Opt for This Calculator?
- Reliable Data: Accurate Energean plc (ENOGL) financial metrics provide trustworthy valuation outcomes.
- Tailorable: Modify essential factors such as growth rates, WACC, and tax rates to fit your forecasts.
- Efficient: Built-in calculations save you the time of starting from the ground up.
- High-Quality Tool: Crafted for investors, analysts, and consultants in the energy sector.
- Easy to Use: Intuitive design and clear instructions ensure accessibility for all users.
Who Can Benefit from Energean plc (ENOGL)?
- Investors: Empower your investment choices with a sophisticated valuation tool tailored for professional use.
- Financial Analysts: Enhance efficiency with a ready-to-use DCF model designed for personalization.
- Consultants: Seamlessly modify the template for impactful client presentations or detailed reports.
- Finance Enthusiasts: Expand your knowledge of valuation methodologies through practical, real-world examples.
- Educators and Students: Utilize it as an effective educational resource in finance-oriented studies.
Overview of the Template Contents
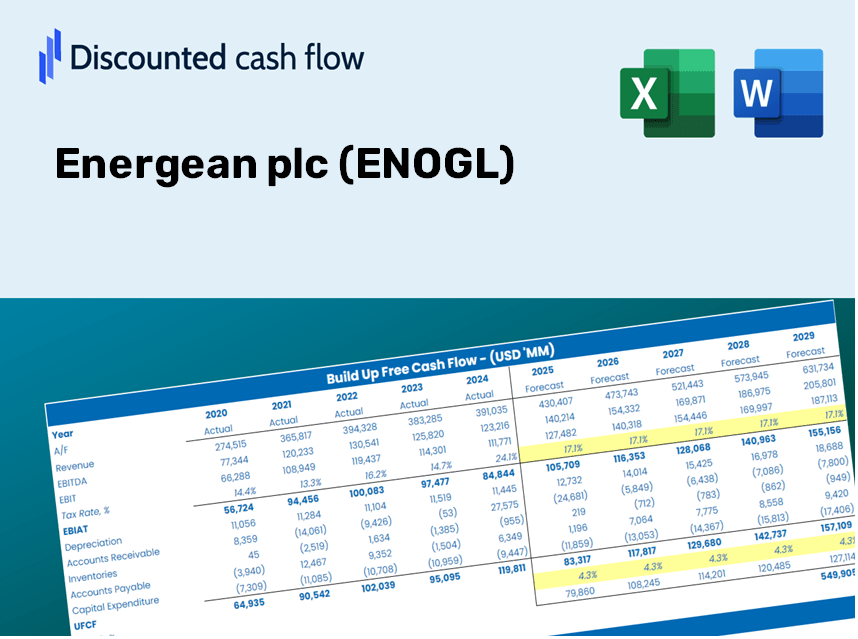
- Preloaded ENOGL Data: Historical and projected financial figures, including revenue, EBIT, and capital expenditures.
- DCF and WACC Models: Professional-grade templates for determining intrinsic value and Weighted Average Cost of Capital.
- Editable Inputs: Cells highlighted in yellow for modifying revenue growth, tax rates, and discount rates.
- Financial Statements: Detailed annual and quarterly financial reports for comprehensive analysis.
- Key Ratios: Profitability, leverage, and efficiency metrics to assess performance.
- Dashboard and Charts: Visual representations of valuation results and underlying assumptions.
Disclaimer
All information, articles, and product details provided on this website are for general informational and educational purposes only. We do not claim any ownership over, nor do we intend to infringe upon, any trademarks, copyrights, logos, brand names, or other intellectual property mentioned or depicted on this site. Such intellectual property remains the property of its respective owners, and any references here are made solely for identification or informational purposes, without implying any affiliation, endorsement, or partnership.
We make no representations or warranties, express or implied, regarding the accuracy, completeness, or suitability of any content or products presented. Nothing on this website should be construed as legal, tax, investment, financial, medical, or other professional advice. In addition, no part of this site—including articles or product references—constitutes a solicitation, recommendation, endorsement, advertisement, or offer to buy or sell any securities, franchises, or other financial instruments, particularly in jurisdictions where such activity would be unlawful.
All content is of a general nature and may not address the specific circumstances of any individual or entity. It is not a substitute for professional advice or services. Any actions you take based on the information provided here are strictly at your own risk. You accept full responsibility for any decisions or outcomes arising from your use of this website and agree to release us from any liability in connection with your use of, or reliance upon, the content or products found herein.