
|
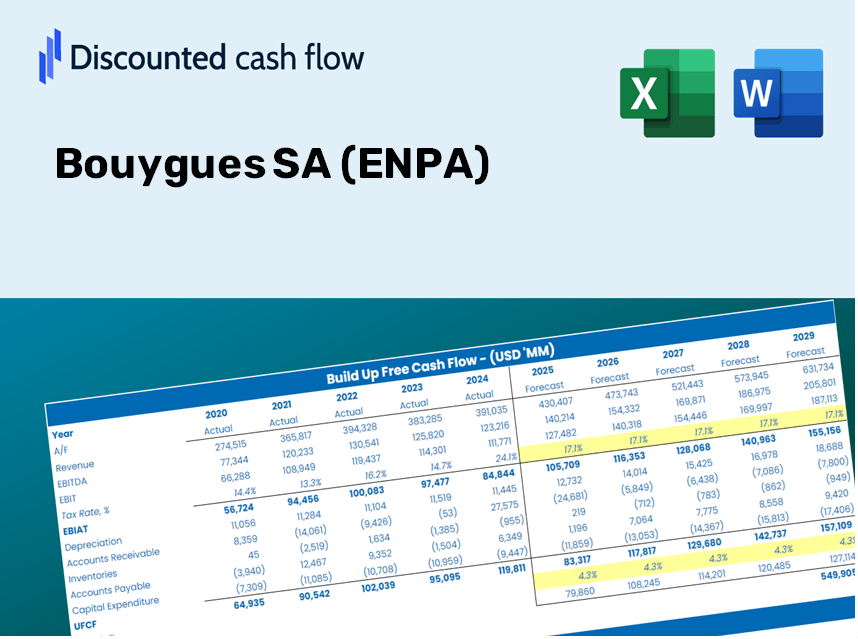
Bouygues SA (en.pa) Évaluation DCF |
Entièrement Modifiable: Adapté À Vos Besoins Dans Excel Ou Sheets
Conception Professionnelle: Modèles Fiables Et Conformes Aux Normes Du Secteur
Pré-Construits Pour Une Utilisation Rapide Et Efficace
Compatible MAC/PC, entièrement débloqué
Aucune Expertise N'Est Requise; Facile À Suivre
Bouygues SA (EN.PA) Bundle
Vous cherchez à déterminer la valeur intrinsèque de Bouygues SA? Notre calculatrice (ENPA) DCF intègre des données réelles avec des fonctionnalités de personnalisation complètes, vous permettant d'affiner les prévisions et d'améliorer vos choix d'investissement.
Discounted Cash Flow (DCF) - (USD MM)
| Year | AY1 2020 |
AY2 2021 |
AY3 2022 |
AY4 2023 |
AY5 2024 |
FY1 2025 |
FY2 2026 |
FY3 2027 |
FY4 2028 |
FY5 2029 |
|---|---|---|---|---|---|---|---|---|---|---|
| Revenue | 34,760.0 | 37,589.0 | 44,322.0 | 56,056.0 | 56,752.0 | 64,380.4 | 73,034.3 | 82,851.3 | 93,988.0 | 106,621.6 |
| Revenue Growth, % | 0 | 8.14 | 17.91 | 26.47 | 1.24 | 13.44 | 13.44 | 13.44 | 13.44 | 13.44 |
| EBITDA | 3,078.0 | 4,383.0 | 4,670.0 | 5,232.0 | 4,516.0 | 6,224.7 | 7,061.4 | 8,010.5 | 9,087.3 | 10,308.8 |
| EBITDA, % | 8.86 | 11.66 | 10.54 | 9.33 | 7.96 | 9.67 | 9.67 | 9.67 | 9.67 | 9.67 |
| Depreciation | 2,191.0 | 2,418.0 | 2,674.0 | 2,915.0 | 2,316.0 | 3,611.8 | 4,097.2 | 4,648.0 | 5,272.8 | 5,981.5 |
| Depreciation, % | 6.3 | 6.43 | 6.03 | 5.2 | 4.08 | 5.61 | 5.61 | 5.61 | 5.61 | 5.61 |
| EBIT | 887.0 | 1,965.0 | 1,996.0 | 2,317.0 | 2,200.0 | 2,612.9 | 2,964.1 | 3,362.5 | 3,814.5 | 4,327.3 |
| EBIT, % | 2.55 | 5.23 | 4.5 | 4.13 | 3.88 | 4.06 | 4.06 | 4.06 | 4.06 | 4.06 |
| Total Cash | 4,224.0 | 6,501.0 | 5,736.0 | 5,548.0 | 5,567.0 | 7,995.4 | 9,070.1 | 10,289.3 | 11,672.4 | 13,241.4 |
| Total Cash, percent | .0 | .0 | .0 | .0 | .0 | .0 | .0 | .0 | .0 | .0 |
| Account Receivables | 11,142.0 | 12,447.0 | 19,643.0 | 14,928.0 | 19,140.0 | 21,869.1 | 24,808.7 | 28,143.4 | 31,926.3 | 36,217.8 |
| Account Receivables, % | 32.05 | 33.11 | 44.32 | 26.63 | 33.73 | 33.97 | 33.97 | 33.97 | 33.97 | 33.97 |
| Inventories | 2,839.0 | 2,810.0 | 3,131.0 | 2,924.0 | 3,321.0 | 4,348.9 | 4,933.5 | 5,596.6 | 6,348.9 | 7,202.3 |
| Inventories, % | 8.17 | 7.48 | 7.06 | 5.22 | 5.85 | 6.76 | 6.76 | 6.76 | 6.76 | 6.76 |
| Accounts Payable | 7,200.0 | 8,266.0 | 11,116.0 | 11,006.0 | 10,761.0 | 13,697.5 | 15,538.7 | 17,627.4 | 19,996.8 | 22,684.7 |
| Accounts Payable, % | 20.71 | 21.99 | 25.08 | 19.63 | 18.96 | 21.28 | 21.28 | 21.28 | 21.28 | 21.28 |
| Capital Expenditure | -2,648.0 | -2,536.0 | -2,730.0 | -2,664.0 | -1,989.0 | -3,705.9 | -4,204.0 | -4,769.1 | -5,410.2 | -6,137.4 |
| Capital Expenditure, % | -7.62 | -6.75 | -6.16 | -4.75 | -3.5 | -5.76 | -5.76 | -5.76 | -5.76 | -5.76 |
| Tax Rate, % | 42.47 | 42.47 | 42.47 | 42.47 | 42.47 | 42.47 | 42.47 | 42.47 | 42.47 | 42.47 |
| EBITAT | 567.9 | 1,272.7 | 1,250.6 | 1,378.5 | 1,265.7 | 1,612.0 | 1,828.7 | 2,074.5 | 2,353.4 | 2,669.7 |
| Depreciation | ||||||||||
| Changes in Account Receivables | ||||||||||
| Changes in Inventories | ||||||||||
| Changes in Accounts Payable | ||||||||||
| Capital Expenditure | ||||||||||
| UFCF | -6,670.1 | 944.7 | -3,472.4 | 6,441.5 | -3,261.3 | 697.4 | 39.0 | 44.2 | 50.2 | 56.9 |
| WACC, % | 5.09 | 5.11 | 5.06 | 4.98 | 4.94 | 5.04 | 5.04 | 5.04 | 5.04 | 5.04 |
| PV UFCF | ||||||||||
| SUM PV UFCF | 823.2 | |||||||||
| Long Term Growth Rate, % | 3.00 | |||||||||
| Free cash flow (T + 1) | 59 | |||||||||
| Terminal Value | 2,879 | |||||||||
| Present Terminal Value | 2,252 | |||||||||
| Enterprise Value | 3,075 | |||||||||
| Net Debt | 9,175 | |||||||||
| Equity Value | -6,100 | |||||||||
| Diluted Shares Outstanding, MM | 378 | |||||||||
| Equity Value Per Share | -16.14 |
What You Will Receive
- Genuine Bouygues SA Financials: Access to both historical and projected data for precise valuation.
- Customizable Inputs: Adjust parameters such as WACC, tax rates, revenue growth, and capital expenditures.
- Automated Calculations: Intrinsic value and NPV are calculated in real-time.
- Scenario Analysis: Explore various scenarios to assess Bouygues SA’s (ENPA) future outlook.
- User-Friendly Design: Crafted for industry professionals while remaining approachable for newcomers.
Key Features
- 🔍 Real-Life Bouygues SA Financials: Pre-filled historical and projected data for Bouygues SA (ENPA).
- ✏️ Fully Customizable Inputs: Adjust all essential parameters (yellow cells) such as WACC, growth %, and tax rates.
- 📊 Professional DCF Valuation: Integrated formulas calculate Bouygues SA’s intrinsic value using the Discounted Cash Flow method.
- ⚡ Instant Results: Visualize Bouygues SA’s valuation immediately after making adjustments.
- Scenario Analysis: Evaluate and compare outcomes for different financial assumptions side by side.
How It Works
- 1. Access the Template: Download and open the Excel file featuring Bouygues SA’s (ENPA) preloaded data.
- 2. Modify Assumptions: Adjust key variables such as growth rates, WACC, and capital expenditures.
- 3. See Results in Real-Time: The DCF model automatically computes intrinsic value and NPV.
- 4. Explore Scenarios: Evaluate various forecasts to assess different valuation results.
- 5. Present with Assurance: Share expert valuation insights to bolster your decision-making.
Why Opt for This Calculator?
- All-in-One Solution: Features DCF, WACC, and financial ratio analyses in a single tool.
- Flexible Inputs: Modify the yellow-highlighted fields to explore different scenarios.
- In-Depth Analysis: Automatically computes Bouygues SA's intrinsic value and Net Present Value.
- Data Preloaded: Comes with historical and projected data for accurate baselines.
- Professional Standard: Perfect for financial analysts, investors, and business advisors.
Who Can Benefit from This Product?
- Institutional Investors: Develop comprehensive and trustworthy valuation models for analyzing Bouygues SA (ENPA).
- Corporate Finance Departments: Evaluate valuation scenarios to steer organizational strategy.
- Financial Consultants and Advisers: Deliver precise valuation insights to clients regarding Bouygues SA (ENPA).
- Students and Educators: Utilize real-world data to enhance learning and practice in financial modeling.
- Industry Enthusiasts: Gain insights into how companies like Bouygues SA (ENPA) are assessed in the market.
Contents of the Template
- Preloaded Bouygues SA (ENPA) Data: Historical and projected financial metrics, including revenue, EBITDA, and capital expenditures.
- DCF and WACC Models: Advanced sheets for computing intrinsic value and Weighted Average Cost of Capital.
- Editable Inputs: Yellow-highlighted cells for modifying revenue growth, tax rates, and discount rates.
- Financial Statements: Detailed annual and quarterly financials for in-depth analysis.
- Key Ratios: Metrics for profitability, leverage, and efficiency to assess performance.
- Dashboard and Charts: Visual representations of valuation results and underlying assumptions.
Disclaimer
All information, articles, and product details provided on this website are for general informational and educational purposes only. We do not claim any ownership over, nor do we intend to infringe upon, any trademarks, copyrights, logos, brand names, or other intellectual property mentioned or depicted on this site. Such intellectual property remains the property of its respective owners, and any references here are made solely for identification or informational purposes, without implying any affiliation, endorsement, or partnership.
We make no representations or warranties, express or implied, regarding the accuracy, completeness, or suitability of any content or products presented. Nothing on this website should be construed as legal, tax, investment, financial, medical, or other professional advice. In addition, no part of this site—including articles or product references—constitutes a solicitation, recommendation, endorsement, advertisement, or offer to buy or sell any securities, franchises, or other financial instruments, particularly in jurisdictions where such activity would be unlawful.
All content is of a general nature and may not address the specific circumstances of any individual or entity. It is not a substitute for professional advice or services. Any actions you take based on the information provided here are strictly at your own risk. You accept full responsibility for any decisions or outcomes arising from your use of this website and agree to release us from any liability in connection with your use of, or reliance upon, the content or products found herein.