
|
ENERSYS (ENS) Évaluation DCF |
Entièrement Modifiable: Adapté À Vos Besoins Dans Excel Ou Sheets
Conception Professionnelle: Modèles Fiables Et Conformes Aux Normes Du Secteur
Pré-Construits Pour Une Utilisation Rapide Et Efficace
Compatible MAC/PC, entièrement débloqué
Aucune Expertise N'Est Requise; Facile À Suivre
EnerSys (ENS) Bundle
Que vous soyez un investisseur ou un analyste, cette calculatrice DCF Enersys (ENS) est l'outil parfait pour une évaluation précise. Équipé de données réelles d'Enersys, vous pouvez ajuster les prévisions et observer les effets en temps réel.
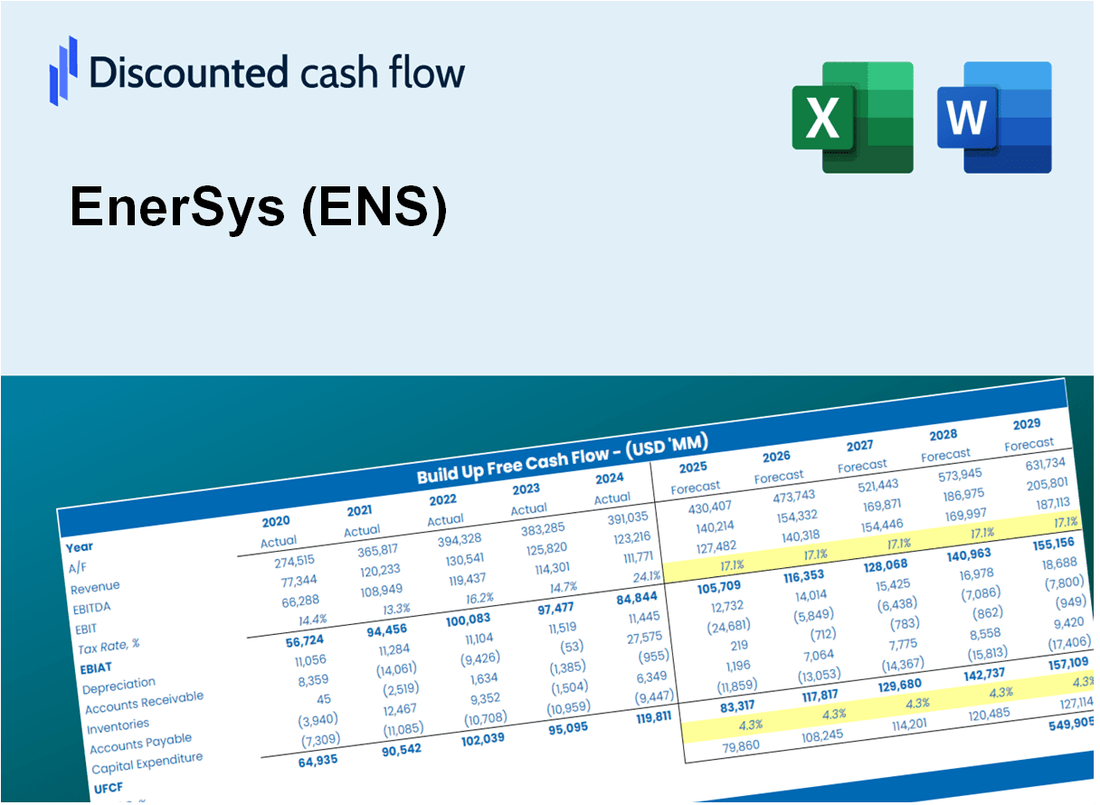
Discounted Cash Flow (DCF) - (USD MM)
| Year | AY1 2021 |
AY2 2022 |
AY3 2023 |
AY4 2024 |
AY5 2025 |
FY1 2026 |
FY2 2027 |
FY3 2028 |
FY4 2029 |
FY5 2030 |
|---|---|---|---|---|---|---|---|---|---|---|
| Revenue | 2,977.9 | 3,357.3 | 3,708.6 | 3,581.9 | 3,617.6 | 3,805.5 | 4,003.3 | 4,211.3 | 4,430.1 | 4,660.3 |
| Revenue Growth, % | 0 | 12.74 | 10.46 | -3.42 | 0.99691 | 5.2 | 5.2 | 5.2 | 5.2 | 5.2 |
| EBITDA | 305.0 | 307.6 | 366.6 | 441.1 | 558.6 | 434.2 | 456.7 | 480.5 | 505.4 | 531.7 |
| EBITDA, % | 10.24 | 9.16 | 9.89 | 12.32 | 15.44 | 11.41 | 11.41 | 11.41 | 11.41 | 11.41 |
| Depreciation | 94.1 | 95.9 | 91.2 | 92.0 | 100.9 | 105.3 | 110.7 | 116.5 | 122.5 | 128.9 |
| Depreciation, % | 3.16 | 2.86 | 2.46 | 2.57 | 2.79 | 2.77 | 2.77 | 2.77 | 2.77 | 2.77 |
| EBIT | 210.9 | 211.7 | 275.5 | 349.1 | 457.7 | 328.9 | 346.0 | 364.0 | 382.9 | 402.8 |
| EBIT, % | 7.08 | 6.31 | 7.43 | 9.75 | 12.65 | 8.64 | 8.64 | 8.64 | 8.64 | 8.64 |
| Total Cash | 451.8 | 402.5 | 346.7 | 333.3 | 343.1 | 420.9 | 442.8 | 465.8 | 490.0 | 515.4 |
| Total Cash, percent | .0 | .0 | .0 | .0 | .0 | .0 | .0 | .0 | .0 | .0 |
| Account Receivables | 661.0 | 796.0 | 693.4 | 584.2 | 676.4 | 758.1 | 797.5 | 839.0 | 882.6 | 928.4 |
| Account Receivables, % | 22.2 | 23.71 | 18.7 | 16.31 | 18.7 | 19.92 | 19.92 | 19.92 | 19.92 | 19.92 |
| Inventories | 518.2 | 715.7 | 797.8 | 697.7 | 740.0 | 762.4 | 802.0 | 843.7 | 887.5 | 933.6 |
| Inventories, % | 17.4 | 21.32 | 21.51 | 19.48 | 20.46 | 20.03 | 20.03 | 20.03 | 20.03 | 20.03 |
| Accounts Payable | 323.9 | 393.1 | 378.6 | 369.5 | 405.7 | 413.5 | 434.9 | 457.5 | 481.3 | 506.3 |
| Accounts Payable, % | 10.88 | 11.71 | 10.21 | 10.31 | 11.21 | 10.86 | 10.86 | 10.86 | 10.86 | 10.86 |
| Capital Expenditure | -70.0 | -74.0 | -88.8 | -86.4 | -121.0 | -96.7 | -101.8 | -107.0 | -112.6 | -118.5 |
| Capital Expenditure, % | -2.35 | -2.21 | -2.39 | -2.41 | -3.35 | -2.54 | -2.54 | -2.54 | -2.54 | -2.54 |
| Tax Rate, % | 10.54 | 10.54 | 10.54 | 10.54 | 10.54 | 10.54 | 10.54 | 10.54 | 10.54 | 10.54 |
| EBITAT | 177.7 | 175.2 | 229.9 | 321.5 | 409.5 | 284.2 | 299.0 | 314.5 | 330.9 | 348.1 |
| Depreciation | ||||||||||
| Changes in Account Receivables | ||||||||||
| Changes in Inventories | ||||||||||
| Changes in Accounts Payable | ||||||||||
| Capital Expenditure | ||||||||||
| UFCF | -653.5 | -66.3 | 238.4 | 527.2 | 291.1 | 196.4 | 250.4 | 263.4 | 277.1 | 291.5 |
| WACC, % | 7.81 | 7.79 | 7.8 | 7.87 | 7.85 | 7.82 | 7.82 | 7.82 | 7.82 | 7.82 |
| PV UFCF | ||||||||||
| SUM PV UFCF | 1,012.8 | |||||||||
| Long Term Growth Rate, % | 3.50 | |||||||||
| Free cash flow (T + 1) | 302 | |||||||||
| Terminal Value | 6,979 | |||||||||
| Present Terminal Value | 4,789 | |||||||||
| Enterprise Value | 5,802 | |||||||||
| Net Debt | 859 | |||||||||
| Equity Value | 4,942 | |||||||||
| Diluted Shares Outstanding, MM | 40 | |||||||||
| Equity Value Per Share | 122.22 |
What You Will Get
- Real ENS Financials: Access to historical and projected data for precise valuation.
- Customizable Inputs: Adjust WACC, tax rates, revenue growth, and capital expenditures as needed.
- Instant Calculations: Intrinsic value and NPV are computed in real-time.
- Scenario Analysis: Evaluate various scenarios to assess EnerSys's future performance.
- User-Friendly Design: Designed for experts, yet easy to navigate for newcomers.
Key Features
- 🔍 Real-Life ENS Financials: Pre-filled historical and projected data for EnerSys (ENS).
- ✏️ Fully Customizable Inputs: Adjust all critical parameters (yellow cells) like WACC, growth %, and tax rates.
- 📊 Professional DCF Valuation: Built-in formulas calculate EnerSys’s intrinsic value using the Discounted Cash Flow method.
- ⚡ Instant Results: Visualize EnerSys’s valuation instantly after making changes.
- Scenario Analysis: Test and compare outcomes for various financial assumptions side-by-side.
How It Works
- Step 1: Download the Excel file.
- Step 2: Review pre-entered EnerSys (ENS) data (historical and projected).
- Step 3: Adjust key assumptions (yellow cells) based on your analysis.
- Step 4: View automatic recalculations for EnerSys (ENS) intrinsic value.
- Step 5: Use the outputs for investment decisions or reporting.
Why Choose This Calculator for EnerSys (ENS)?
- User-Friendly Interface: Tailored for both novices and seasoned professionals.
- Customizable Inputs: Adjust parameters effortlessly to suit your financial analysis.
- Real-Time Feedback: Observe immediate updates to EnerSys’s valuation as you change inputs.
- Pre-Loaded Data: Comes with EnerSys’s actual financial figures for swift evaluations.
- Preferred by Experts: Utilized by investors and analysts for making well-informed choices.
Who Should Use This Product?
- Investors: Evaluate EnerSys's valuation before making stock transactions.
- CFOs and Financial Analysts: Optimize valuation workflows and assess financial forecasts.
- Startup Founders: Discover how large public companies like EnerSys are appraised.
- Consultants: Provide expert valuation reports for your clients.
- Students and Educators: Utilize real-world data to practice and instruct on valuation methods.
What the Template Contains
- Comprehensive DCF Model: Editable template featuring detailed valuation calculations tailored for EnerSys (ENS).
- Real-World Data: EnerSys’s historical and projected financials preloaded for in-depth analysis.
- Customizable Parameters: Modify WACC, growth rates, and tax assumptions to explore various scenarios.
- Financial Statements: Complete annual and quarterly breakdowns for enhanced insights into EnerSys (ENS).
- Key Ratios: Integrated analysis for profitability, efficiency, and leverage specific to EnerSys (ENS).
- Dashboard with Visual Outputs: Charts and tables designed for clear, actionable results regarding EnerSys (ENS).
Disclaimer
All information, articles, and product details provided on this website are for general informational and educational purposes only. We do not claim any ownership over, nor do we intend to infringe upon, any trademarks, copyrights, logos, brand names, or other intellectual property mentioned or depicted on this site. Such intellectual property remains the property of its respective owners, and any references here are made solely for identification or informational purposes, without implying any affiliation, endorsement, or partnership.
We make no representations or warranties, express or implied, regarding the accuracy, completeness, or suitability of any content or products presented. Nothing on this website should be construed as legal, tax, investment, financial, medical, or other professional advice. In addition, no part of this site—including articles or product references—constitutes a solicitation, recommendation, endorsement, advertisement, or offer to buy or sell any securities, franchises, or other financial instruments, particularly in jurisdictions where such activity would be unlawful.
All content is of a general nature and may not address the specific circumstances of any individual or entity. It is not a substitute for professional advice or services. Any actions you take based on the information provided here are strictly at your own risk. You accept full responsibility for any decisions or outcomes arising from your use of this website and agree to release us from any liability in connection with your use of, or reliance upon, the content or products found herein.