
|
Eramet S.A. (ERA.PA) Évaluation DCF |
Entièrement Modifiable: Adapté À Vos Besoins Dans Excel Ou Sheets
Conception Professionnelle: Modèles Fiables Et Conformes Aux Normes Du Secteur
Pré-Construits Pour Une Utilisation Rapide Et Efficace
Compatible MAC/PC, entièrement débloqué
Aucune Expertise N'Est Requise; Facile À Suivre
ERAMET S.A. (ERA.PA) Bundle
Que vous soyez un investisseur ou un analyste, cette calculatrice DCF Eramet S.A. (ERAPA) est votre outil incontournable pour une évaluation précise. Préchargé avec des données réelles d'Eramet S.A., vous pouvez ajuster les prévisions et observer instantanément les effets.
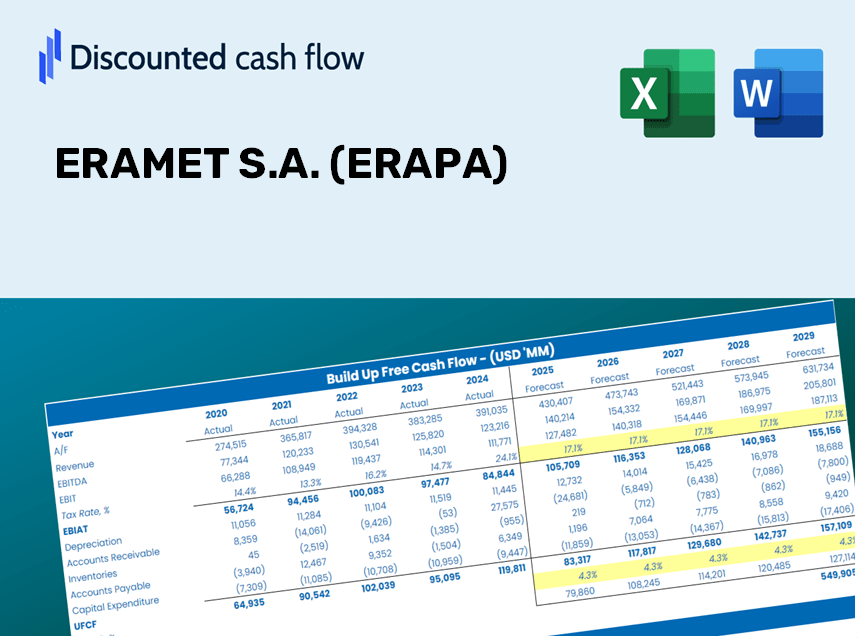
Discounted Cash Flow (DCF) - (USD MM)
| Year | AY1 2020 |
AY2 2021 |
AY3 2022 |
AY4 2023 |
AY5 2024 |
FY1 2025 |
FY2 2026 |
FY3 2027 |
FY4 2028 |
FY5 2029 |
|---|---|---|---|---|---|---|---|---|---|---|
| Revenue | 2,814.0 | 3,710.0 | 5,014.0 | 3,340.0 | 2,933.0 | 3,090.0 | 3,255.5 | 3,429.8 | 3,613.4 | 3,806.9 |
| Revenue Growth, % | 0 | 31.84 | 35.15 | -33.39 | -12.19 | 5.35 | 5.35 | 5.35 | 5.35 | 5.35 |
| EBITDA | 262.0 | 1,150.0 | 1,324.0 | 209.0 | 231.0 | 499.6 | 526.4 | 554.6 | 584.3 | 615.6 |
| EBITDA, % | 9.31 | 31 | 26.41 | 6.26 | 7.88 | 16.17 | 16.17 | 16.17 | 16.17 | 16.17 |
| Depreciation | 250.0 | 259.0 | 271.0 | 240.0 | 238.0 | 226.0 | 238.1 | 250.9 | 264.3 | 278.4 |
| Depreciation, % | 8.88 | 6.98 | 5.4 | 7.19 | 8.11 | 7.31 | 7.31 | 7.31 | 7.31 | 7.31 |
| EBIT | 12.0 | 891.0 | 1,053.0 | -31.0 | -7.0 | 273.6 | 288.3 | 303.7 | 320.0 | 337.1 |
| EBIT, % | 0.42644 | 24.02 | 21 | -0.92814 | -0.23866 | 8.86 | 8.86 | 8.86 | 8.86 | 8.86 |
| Total Cash | 1,811.0 | 1,176.0 | 1,660.0 | 1,606.0 | 913.0 | 1,287.8 | 1,356.7 | 1,429.4 | 1,505.9 | 1,586.5 |
| Total Cash, percent | .0 | .0 | .0 | .0 | .0 | .0 | .0 | .0 | .0 | .0 |
| Account Receivables | 641.0 | 669.0 | 802.0 | 712.0 | 786.0 | 648.4 | 683.1 | 719.7 | 758.3 | 798.9 |
| Account Receivables, % | 22.78 | 18.03 | 16 | 21.32 | 26.8 | 20.98 | 20.98 | 20.98 | 20.98 | 20.98 |
| Inventories | 906.0 | 577.0 | 724.0 | 619.0 | 692.0 | 644.7 | 679.2 | 715.6 | 753.9 | 794.2 |
| Inventories, % | 32.2 | 15.55 | 14.44 | 18.53 | 23.59 | 20.86 | 20.86 | 20.86 | 20.86 | 20.86 |
| Accounts Payable | 541.0 | 403.0 | 424.0 | 445.0 | 384.0 | 401.5 | 423.0 | 445.6 | 469.5 | 494.6 |
| Accounts Payable, % | 19.23 | 10.86 | 8.46 | 13.32 | 13.09 | 12.99 | 12.99 | 12.99 | 12.99 | 12.99 |
| Capital Expenditure | -313.0 | -312.0 | -588.0 | -595.0 | -687.0 | -448.0 | -472.0 | -497.3 | -523.9 | -552.0 |
| Capital Expenditure, % | -11.12 | -8.41 | -11.73 | -17.81 | -23.42 | -14.5 | -14.5 | -14.5 | -14.5 | -14.5 |
| Tax Rate, % | 66.67 | 66.67 | 66.67 | 66.67 | 66.67 | 66.67 | 66.67 | 66.67 | 66.67 | 66.67 |
| EBITAT | 165.3 | 299.0 | 652.6 | -33.8 | -2.3 | 180.0 | 189.6 | 199.8 | 210.5 | 221.7 |
| Depreciation | ||||||||||
| Changes in Account Receivables | ||||||||||
| Changes in Inventories | ||||||||||
| Changes in Accounts Payable | ||||||||||
| Capital Expenditure | ||||||||||
| UFCF | -903.7 | 409.0 | 76.6 | -172.8 | -659.3 | 160.3 | -92.0 | -97.0 | -102.2 | -107.6 |
| WACC, % | 8.49 | 5.07 | 6.53 | 8.49 | 5.05 | 6.73 | 6.73 | 6.73 | 6.73 | 6.73 |
| PV UFCF | ||||||||||
| SUM PV UFCF | -166.9 | |||||||||
| Long Term Growth Rate, % | 0.50 | |||||||||
| Free cash flow (T + 1) | -108 | |||||||||
| Terminal Value | -1,738 | |||||||||
| Present Terminal Value | -1,255 | |||||||||
| Enterprise Value | -1,422 | |||||||||
| Net Debt | 1,595 | |||||||||
| Equity Value | -3,017 | |||||||||
| Diluted Shares Outstanding, MM | 29 | |||||||||
| Equity Value Per Share | -104.33 |
What You Will Receive
- Customizable Excel Template: A fully adaptable Excel-based DCF Calculator featuring pre-populated financial data for ERAMET S.A. (ERAPA).
- Accurate Historical Data: Comprehensive historical figures and forward-looking projections (highlighted in the yellow cells).
- Flexible Forecasting: Adjust key assumptions such as revenue growth, EBITDA percentage, and WACC to suit your analysis.
- Instant Calculations: See real-time effects of your inputs on the valuation of ERAMET S.A. (ERAPA).
- Professional-Grade Tool: Designed for use by investors, CFOs, consultants, and financial analysts.
- Intuitive Design: Organized for simplicity and ease of navigation, complete with step-by-step guidance.
Core Highlights
- Accurate ERAMET Financials: Gain access to reliable historical data and future projections readily available.
- Tailorable Forecast Parameters: Modify cells highlighted in yellow, including WACC, growth rates, and profit margins.
- Real-time Calculations: Experience automatic updates for DCF, Net Present Value (NPV), and cash flow assessments.
- Interactive Dashboard: Utilize easy-to-interpret charts and summaries to visualize your valuation outcomes.
- Designed for All Levels: A user-friendly layout tailored for investors, CFOs, and consultants alike.
How It Functions
- 1. Access the Template: Download and open the Excel file containing ERAMET S.A. (ERAPA) preloaded data.
- 2. Modify Assumptions: Adjust key inputs such as growth rates, WACC, and capital expenditures.
- 3. View Instant Results: The DCF model automatically computes intrinsic value and NPV.
- 4. Explore Scenarios: Analyze multiple forecasts to evaluate various valuation outcomes.
- 5. Utilize with Assurance: Present expert valuation insights to back your decisions.
Why Opt for This Calculator?
- All-in-One Solution: Combines DCF, WACC, and financial ratio analyses for a thorough evaluation.
- Flexible Inputs: Modify the yellow-highlighted fields to explore different scenarios.
- In-Depth Analysis: Automatically computes the intrinsic value and Net Present Value for ERAMET S.A. (ERAPA).
- Preloaded Information: Historical and projected data provide reliable foundational insights.
- High-Caliber Tool: Perfect for financial analysts, investors, and business consultants.
Who Can Benefit from ERAMET S.A. (ERAPA)?
- Mining and Metallurgy Students: Master extraction and processing techniques using real-world data.
- Researchers: Integrate industry-specific models into studies and academic projects.
- Investors: Evaluate your predictions and assess valuation metrics for ERAMET S.A. (ERAPA) shares.
- Market Analysts: Enhance your analysis with a ready-to-use, flexible financial model.
- Entrepreneurs: Understand how major companies like ERAMET S.A. (ERAPA) are evaluated within the industry.
Overview of the Template Contents
- Preloaded ERAMET Data: Historical and projected financial figures, including revenue, EBIT, and capital expenditures.
- DCF and WACC Models: Advanced financial models for determining intrinsic value and Weighted Average Cost of Capital.
- Editable Inputs: Yellow-highlighted cells for modifying revenue growth, tax rates, and discount rates.
- Financial Statements: Detailed annual and quarterly financial reports for comprehensive analysis.
- Key Ratios: Profitability, leverage, and efficiency ratios to assess overall performance.
- Dashboard and Charts: Visual representations of valuation results and underlying assumptions.
Disclaimer
All information, articles, and product details provided on this website are for general informational and educational purposes only. We do not claim any ownership over, nor do we intend to infringe upon, any trademarks, copyrights, logos, brand names, or other intellectual property mentioned or depicted on this site. Such intellectual property remains the property of its respective owners, and any references here are made solely for identification or informational purposes, without implying any affiliation, endorsement, or partnership.
We make no representations or warranties, express or implied, regarding the accuracy, completeness, or suitability of any content or products presented. Nothing on this website should be construed as legal, tax, investment, financial, medical, or other professional advice. In addition, no part of this site—including articles or product references—constitutes a solicitation, recommendation, endorsement, advertisement, or offer to buy or sell any securities, franchises, or other financial instruments, particularly in jurisdictions where such activity would be unlawful.
All content is of a general nature and may not address the specific circumstances of any individual or entity. It is not a substitute for professional advice or services. Any actions you take based on the information provided here are strictly at your own risk. You accept full responsibility for any decisions or outcomes arising from your use of this website and agree to release us from any liability in connection with your use of, or reliance upon, the content or products found herein.