
|
Eurofins Scientific SE (ERF.PA) Évaluation DCF |
Entièrement Modifiable: Adapté À Vos Besoins Dans Excel Ou Sheets
Conception Professionnelle: Modèles Fiables Et Conformes Aux Normes Du Secteur
Pré-Construits Pour Une Utilisation Rapide Et Efficace
Compatible MAC/PC, entièrement débloqué
Aucune Expertise N'Est Requise; Facile À Suivre
Eurofins Scientific SE (ERF.PA) Bundle
Découvrez la valeur réelle d'Eurofins Scientific SE avec notre calculatrice avancée DCF! Ajustez les hypothèses critiques, explorez divers scénarios et examinez comment les changements influencent l'évaluation d'Eurofins Scientific SE - le tout dans un seul modèle Excel.
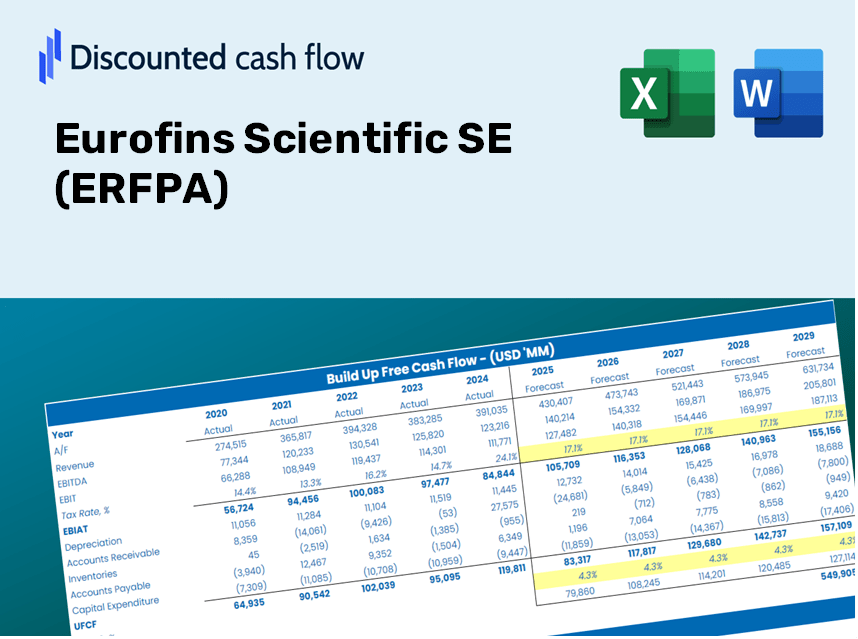
Discounted Cash Flow (DCF) - (USD MM)
| Year | AY1 2020 |
AY2 2021 |
AY3 2022 |
AY4 2023 |
AY5 2024 |
FY1 2025 |
FY2 2026 |
FY3 2027 |
FY4 2028 |
FY5 2029 |
|---|---|---|---|---|---|---|---|---|---|---|
| Revenue | 5,438.8 | 6,717.7 | 6,712.1 | 6,514.6 | 6,951.0 | 7,423.4 | 7,928.0 | 8,466.9 | 9,042.3 | 9,656.9 |
| Revenue Growth, % | 0 | 23.51 | -0.08336186 | -2.94 | 6.7 | 6.8 | 6.8 | 6.8 | 6.8 | 6.8 |
| EBITDA | 1,283.0 | 1,711.5 | 1,362.1 | 1,217.0 | 1,381.7 | 1,602.3 | 1,711.2 | 1,827.5 | 1,951.7 | 2,084.3 |
| EBITDA, % | 23.59 | 25.48 | 20.29 | 18.68 | 19.88 | 21.58 | 21.58 | 21.58 | 21.58 | 21.58 |
| Depreciation | 494.3 | 525.2 | 607.2 | 664.3 | 691.4 | 684.4 | 730.9 | 780.6 | 833.6 | 890.3 |
| Depreciation, % | 9.09 | 7.82 | 9.05 | 10.2 | 9.95 | 9.22 | 9.22 | 9.22 | 9.22 | 9.22 |
| EBIT | 788.7 | 1,186.3 | 754.9 | 552.7 | 690.3 | 917.9 | 980.3 | 1,046.9 | 1,118.0 | 1,194.0 |
| EBIT, % | 14.5 | 17.66 | 11.25 | 8.48 | 9.93 | 12.36 | 12.36 | 12.36 | 12.36 | 12.36 |
| Total Cash | 912.4 | 515.3 | 486.6 | 1,221.2 | 613.9 | 880.0 | 939.8 | 1,003.7 | 1,071.9 | 1,144.8 |
| Total Cash, percent | .0 | .0 | .0 | .0 | .0 | .0 | .0 | .0 | .0 | .0 |
| Account Receivables | 1,389.1 | 1,581.0 | 1,597.2 | 1,617.0 | 1,507.1 | 1,772.3 | 1,892.8 | 2,021.4 | 2,158.8 | 2,305.6 |
| Account Receivables, % | 25.54 | 23.53 | 23.8 | 24.82 | 21.68 | 23.87 | 23.87 | 23.87 | 23.87 | 23.87 |
| Inventories | 157.0 | 154.2 | 145.6 | 139.0 | 141.9 | 171.1 | 182.8 | 195.2 | 208.5 | 222.6 |
| Inventories, % | 2.89 | 2.3 | 2.17 | 2.13 | 2.04 | 2.31 | 2.31 | 2.31 | 2.31 | 2.31 |
| Accounts Payable | 542.0 | 627.6 | 647.7 | 600.2 | 645.9 | 704.7 | 752.6 | 803.7 | 858.4 | 916.7 |
| Accounts Payable, % | 9.97 | 9.34 | 9.65 | 9.21 | 9.29 | 9.49 | 9.49 | 9.49 | 9.49 | 9.49 |
| Capital Expenditure | -355.5 | -519.5 | -660.2 | -550.1 | -528.4 | -596.1 | -636.6 | -679.9 | -726.1 | -775.5 |
| Capital Expenditure, % | -6.54 | -7.73 | -9.84 | -8.44 | -7.6 | -8.03 | -8.03 | -8.03 | -8.03 | -8.03 |
| Tax Rate, % | 26.72 | 26.72 | 26.72 | 26.72 | 26.72 | 26.72 | 26.72 | 26.72 | 26.72 | 26.72 |
| EBITAT | 612.7 | 878.7 | 590.6 | 405.2 | 505.8 | 691.3 | 738.3 | 788.4 | 842.0 | 899.2 |
| Depreciation | ||||||||||
| Changes in Account Receivables | ||||||||||
| Changes in Inventories | ||||||||||
| Changes in Accounts Payable | ||||||||||
| Capital Expenditure | ||||||||||
| UFCF | -252.6 | 780.9 | 550.1 | 458.7 | 821.5 | 543.8 | 748.3 | 799.2 | 853.5 | 911.5 |
| WACC, % | 6.15 | 6.12 | 6.16 | 6.11 | 6.11 | 6.13 | 6.13 | 6.13 | 6.13 | 6.13 |
| PV UFCF | ||||||||||
| SUM PV UFCF | 3,195.2 | |||||||||
| Long Term Growth Rate, % | 3.00 | |||||||||
| Free cash flow (T + 1) | 939 | |||||||||
| Terminal Value | 30,011 | |||||||||
| Present Terminal Value | 22,291 | |||||||||
| Enterprise Value | 25,486 | |||||||||
| Net Debt | 2,996 | |||||||||
| Equity Value | 22,490 | |||||||||
| Diluted Shares Outstanding, MM | 195 | |||||||||
| Equity Value Per Share | 115.63 |
Benefits You’ll Receive
- Adjustable Forecast Variables: Easily modify assumptions (growth %, margins, WACC) to develop various scenarios.
- Industry-Specific Data: Eurofins Scientific SE’s financial data pre-populated to kick-start your analysis.
- Automatic DCF Calculations: The template computes Net Present Value (NPV) and intrinsic value automatically.
- Customizable and Professional Design: A refined Excel model tailored to meet your valuation requirements.
- Designed for Analysts and Investors: Perfect for evaluating projections, affirming strategies, and enhancing efficiency.
Key Features
- Pre-Loaded Data: Eurofins Scientific SE’s historical financial statements and pre-filled forecasts.
- Fully Adjustable Inputs: Modify WACC, tax rates, revenue growth, and EBITDA margins.
- Instant Results: Observe Eurofins Scientific SE’s intrinsic value recalibrate in real time.
- Clear Visual Outputs: Dashboard charts showcase valuation results and key metrics.
- Built for Accuracy: A professional tool designed for analysts, investors, and finance professionals.
How It Functions
- Step 1: Download the ready-to-use Excel template featuring Eurofins Scientific SE's (ERFPA) data.
- Step 2: Review the pre-populated sheets to familiarize yourself with the essential metrics.
- Step 3: Adjust forecasts and assumptions in the editable yellow cells (WACC, growth, margins).
- Step 4: Instantly see the updated results, including the intrinsic value of Eurofins Scientific SE (ERFPA).
- Step 5: Utilize the outputs to make informed investment choices or to create detailed reports.
Reasons to Choose This Calculator for Eurofins Scientific SE (ERFPA)
- Designed for Experts: A sophisticated tool tailored for analysts, CFOs, and industry consultants.
- Accurate Financial Data: Eurofins Scientific’s historical and projected financial figures are preloaded for precision.
- Flexibility in Analysis: Effortlessly create and test various forecasts and assumptions.
- Concise Results: Automatically computes intrinsic value, NPV, and essential metrics.
- User-Friendly: Comprehensive step-by-step instructions to facilitate your calculations.
Who Is This Product Ideal For?
- Investors: Empower your investment decisions with a professional-grade valuation tool.
- Financial Analysts: Gain efficiency with a customizable, pre-built DCF model.
- Consultants: Seamlessly modify the template for client presentations or detailed reports.
- Finance Enthusiasts: Enhance your understanding of valuation methods through practical, real-world examples.
- Educators and Students: Utilize this resource as an effective educational tool in finance courses.
Overview of the Template Features
- Pre-Filled DCF Model: Eurofins Scientific SE’s (ERFPA) financial data ready for immediate application.
- WACC Calculator: Comprehensive calculations for the Weighted Average Cost of Capital.
- Financial Ratios: Analyze Eurofins' profitability, leverage, and operational efficiency.
- Editable Inputs: Adjust key assumptions like growth rates, margins, and CAPEX to align with your scenarios.
- Financial Statements: Access annual and quarterly reports for in-depth analysis.
- Interactive Dashboard: Effortlessly visualize crucial valuation metrics and outcomes.
Disclaimer
All information, articles, and product details provided on this website are for general informational and educational purposes only. We do not claim any ownership over, nor do we intend to infringe upon, any trademarks, copyrights, logos, brand names, or other intellectual property mentioned or depicted on this site. Such intellectual property remains the property of its respective owners, and any references here are made solely for identification or informational purposes, without implying any affiliation, endorsement, or partnership.
We make no representations or warranties, express or implied, regarding the accuracy, completeness, or suitability of any content or products presented. Nothing on this website should be construed as legal, tax, investment, financial, medical, or other professional advice. In addition, no part of this site—including articles or product references—constitutes a solicitation, recommendation, endorsement, advertisement, or offer to buy or sell any securities, franchises, or other financial instruments, particularly in jurisdictions where such activity would be unlawful.
All content is of a general nature and may not address the specific circumstances of any individual or entity. It is not a substitute for professional advice or services. Any actions you take based on the information provided here are strictly at your own risk. You accept full responsibility for any decisions or outcomes arising from your use of this website and agree to release us from any liability in connection with your use of, or reliance upon, the content or products found herein.