
|
Espey Mfg. & Electronics Corp. (ESP) Évaluation DCF |
Entièrement Modifiable: Adapté À Vos Besoins Dans Excel Ou Sheets
Conception Professionnelle: Modèles Fiables Et Conformes Aux Normes Du Secteur
Pré-Construits Pour Une Utilisation Rapide Et Efficace
Compatible MAC/PC, entièrement débloqué
Aucune Expertise N'Est Requise; Facile À Suivre
Espey Mfg. & Electronics Corp. (ESP) Bundle
Explorez l'avenir financier de Espey MFG. & Electronics Corp. (ESP) Utilisation de notre calculatrice DCF conviviale! Entrez vos projections pour la croissance, les marges et les dépenses pour calculer la valeur intrinsèque de Espey MFG. & Electronics Corp. (ESP) et informer vos décisions d'investissement.
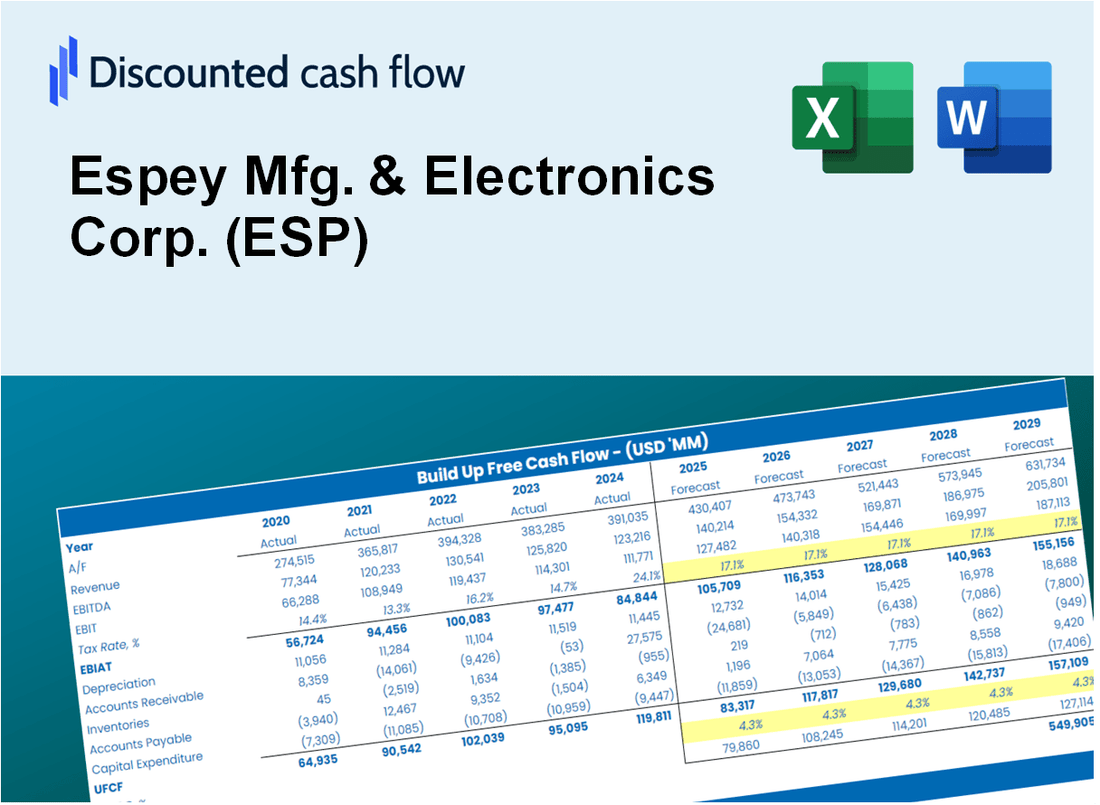
Discounted Cash Flow (DCF) - (USD MM)
| Year | AY1 2021 |
AY2 2022 |
AY3 2023 |
AY4 2024 |
AY5 2025 |
FY1 2026 |
FY2 2027 |
FY3 2028 |
FY4 2029 |
FY5 2030 |
|---|---|---|---|---|---|---|---|---|---|---|
| Revenue | 27.7 | 32.1 | 35.6 | 38.7 | 44.0 | 49.3 | 55.4 | 62.1 | 69.7 | 78.3 |
| Revenue Growth, % | 0 | 15.76 | 10.86 | 8.83 | 13.46 | 12.23 | 12.23 | 12.23 | 12.23 | 12.23 |
| EBITDA | .1 | 2.0 | 4.8 | 7.0 | 10.2 | 6.0 | 6.8 | 7.6 | 8.5 | 9.6 |
| EBITDA, % | 0.33775 | 6.3 | 13.44 | 18.05 | 23.16 | 12.26 | 12.26 | 12.26 | 12.26 | 12.26 |
| Depreciation | .5 | .5 | .5 | .5 | .5 | .7 | .8 | .9 | 1.0 | 1.1 |
| Depreciation, % | 1.87 | 1.54 | 1.36 | 1.17 | 1.03 | 1.4 | 1.4 | 1.4 | 1.4 | 1.4 |
| EBIT | -.4 | 1.5 | 4.3 | 6.5 | 9.7 | 5.4 | 6.0 | 6.8 | 7.6 | 8.5 |
| EBIT, % | -1.54 | 4.76 | 12.08 | 16.88 | 22.14 | 10.87 | 10.87 | 10.87 | 10.87 | 10.87 |
| Total Cash | 9.9 | 11.8 | 14.7 | 23.2 | 43.6 | 26.9 | 30.2 | 33.9 | 38.1 | 42.7 |
| Total Cash, percent | .0 | .0 | .0 | .0 | .0 | .0 | .0 | .0 | .0 | .0 |
| Account Receivables | 5.6 | 5.7 | 5.8 | 6.6 | 7.6 | 8.8 | 9.8 | 11.0 | 12.4 | 13.9 |
| Account Receivables, % | 20.2 | 17.86 | 16.27 | 17.13 | 17.29 | 17.75 | 17.75 | 17.75 | 17.75 | 17.75 |
| Inventories | 18.8 | 18.6 | 19.9 | 19.2 | 17.8 | 26.8 | 30.1 | 33.8 | 37.9 | 42.5 |
| Inventories, % | 67.76 | 57.81 | 55.88 | 49.68 | 40.6 | 54.34 | 54.34 | 54.34 | 54.34 | 54.34 |
| Accounts Payable | 2.7 | 2.1 | 1.2 | 3.8 | 2.6 | 3.5 | 3.9 | 4.4 | 4.9 | 5.5 |
| Accounts Payable, % | 9.8 | 6.48 | 3.41 | 9.68 | 6.01 | 7.08 | 7.08 | 7.08 | 7.08 | 7.08 |
| Capital Expenditure | .0 | -.3 | -.5 | -5.2 | -4.4 | -2.5 | -2.9 | -3.2 | -3.6 | -4.0 |
| Capital Expenditure, % | -0.15704 | -0.94553 | -1.44 | -13.33 | -9.93 | -5.16 | -5.16 | -5.16 | -5.16 | -5.16 |
| Tax Rate, % | 16.3 | 16.3 | 16.3 | 16.3 | 16.3 | 16.3 | 16.3 | 16.3 | 16.3 | 16.3 |
| EBITAT | -.2 | 1.2 | 3.4 | 5.2 | 8.1 | 4.0 | 4.5 | 5.0 | 5.6 | 6.3 |
| Depreciation | ||||||||||
| Changes in Account Receivables | ||||||||||
| Changes in Inventories | ||||||||||
| Changes in Accounts Payable | ||||||||||
| Capital Expenditure | ||||||||||
| UFCF | -21.4 | .9 | 1.1 | 2.8 | 3.6 | -7.2 | -1.6 | -1.7 | -2.0 | -2.2 |
| WACC, % | 4.68 | 4.68 | 4.68 | 4.68 | 4.68 | 4.68 | 4.68 | 4.68 | 4.68 | 4.68 |
| PV UFCF | ||||||||||
| SUM PV UFCF | -13.2 | |||||||||
| Long Term Growth Rate, % | 0.50 | |||||||||
| Free cash flow (T + 1) | -2 | |||||||||
| Terminal Value | -53 | |||||||||
| Present Terminal Value | -42 | |||||||||
| Enterprise Value | -55 | |||||||||
| Net Debt | -19 | |||||||||
| Equity Value | -36 | |||||||||
| Diluted Shares Outstanding, MM | 3 | |||||||||
| Equity Value Per Share | -13.43 |
What You Will Get
- Editable Forecast Inputs: Effortlessly modify assumptions (growth %, margins, WACC) to explore various scenarios.
- Real-World Data: Espey Mfg. & Electronics Corp. (ESP) financial data pre-filled to kickstart your analysis.
- Automatic DCF Outputs: The template computes Net Present Value (NPV) and intrinsic value automatically.
- Customizable and Professional: A sleek Excel model that adjusts to your valuation requirements.
- Built for Analysts and Investors: Perfect for testing projections, validating strategies, and enhancing efficiency.
Key Features
- Accurate Financial Data: Gain access to reliable historical data and future forecasts for Espey Mfg. & Electronics Corp. (ESP).
- Tailored Forecast Inputs: Modify highlighted cells for parameters such as WACC, growth rates, and profit margins.
- Real-Time Calculations: Enjoy automatic updates for DCF, Net Present Value (NPV), and cash flow assessments.
- Interactive Dashboard: View easy-to-understand charts and summaries to interpret your valuation findings.
- Designed for All Users: A user-friendly layout suitable for investors, CFOs, and consultants alike.
How It Works
- Step 1: Download the Excel file for Espey Mfg. & Electronics Corp. (ESP).
- Step 2: Review the pre-filled financial data and forecasts for Espey Mfg. & Electronics Corp. (ESP).
- Step 3: Adjust key inputs such as revenue growth, WACC, and tax rates (highlighted cells).
- Step 4: Observe the DCF model update in real-time as you modify your assumptions.
- Step 5: Evaluate the outputs and leverage the results for your investment strategies.
Why Choose This Calculator for Espey Mfg. & Electronics Corp. (ESP)?
- Designed for Industry Experts: A specialized tool utilized by engineers, financial analysts, and project managers.
- Comprehensive Data: Espey’s historical and projected financials are preloaded for precise analysis.
- Flexible Scenario Analysis: Effortlessly test various forecasts and assumptions.
- Insightful Outputs: Automatically computes intrinsic value, NPV, and essential metrics.
- User-Friendly: Step-by-step guidance simplifies the calculation process.
Who Should Use This Product?
- Engineering Students: Explore manufacturing processes and apply theoretical knowledge to real-world scenarios.
- Researchers: Utilize advanced models in studies related to electronics manufacturing and innovation.
- Investors: Evaluate your investment strategies and assess the performance of Espey Mfg. & Electronics Corp. (ESP).
- Industry Analysts: Enhance your analysis with a comprehensive, customizable financial model specific to the electronics sector.
- Entrepreneurs: Understand how established companies like Espey Mfg. & Electronics Corp. (ESP) navigate market challenges.
What the Template Contains
- Pre-Filled DCF Model: Espey Mfg. & Electronics Corp.'s (ESP) financial data preloaded for immediate use.
- WACC Calculator: Detailed calculations for Weighted Average Cost of Capital.
- Financial Ratios: Evaluate Espey Mfg. & Electronics Corp.'s (ESP) profitability, leverage, and efficiency.
- Editable Inputs: Change assumptions such as growth, margins, and CAPEX to fit your scenarios.
- Financial Statements: Annual and quarterly reports to support detailed analysis.
- Interactive Dashboard: Easily visualize key valuation metrics and results.
Disclaimer
All information, articles, and product details provided on this website are for general informational and educational purposes only. We do not claim any ownership over, nor do we intend to infringe upon, any trademarks, copyrights, logos, brand names, or other intellectual property mentioned or depicted on this site. Such intellectual property remains the property of its respective owners, and any references here are made solely for identification or informational purposes, without implying any affiliation, endorsement, or partnership.
We make no representations or warranties, express or implied, regarding the accuracy, completeness, or suitability of any content or products presented. Nothing on this website should be construed as legal, tax, investment, financial, medical, or other professional advice. In addition, no part of this site—including articles or product references—constitutes a solicitation, recommendation, endorsement, advertisement, or offer to buy or sell any securities, franchises, or other financial instruments, particularly in jurisdictions where such activity would be unlawful.
All content is of a general nature and may not address the specific circumstances of any individual or entity. It is not a substitute for professional advice or services. Any actions you take based on the information provided here are strictly at your own risk. You accept full responsibility for any decisions or outcomes arising from your use of this website and agree to release us from any liability in connection with your use of, or reliance upon, the content or products found herein.