
|
Evolent Health, Inc. (EVH) Évaluation DCF |
Entièrement Modifiable: Adapté À Vos Besoins Dans Excel Ou Sheets
Conception Professionnelle: Modèles Fiables Et Conformes Aux Normes Du Secteur
Pré-Construits Pour Une Utilisation Rapide Et Efficace
Compatible MAC/PC, entièrement débloqué
Aucune Expertise N'Est Requise; Facile À Suivre
Evolent Health, Inc. (EVH) Bundle
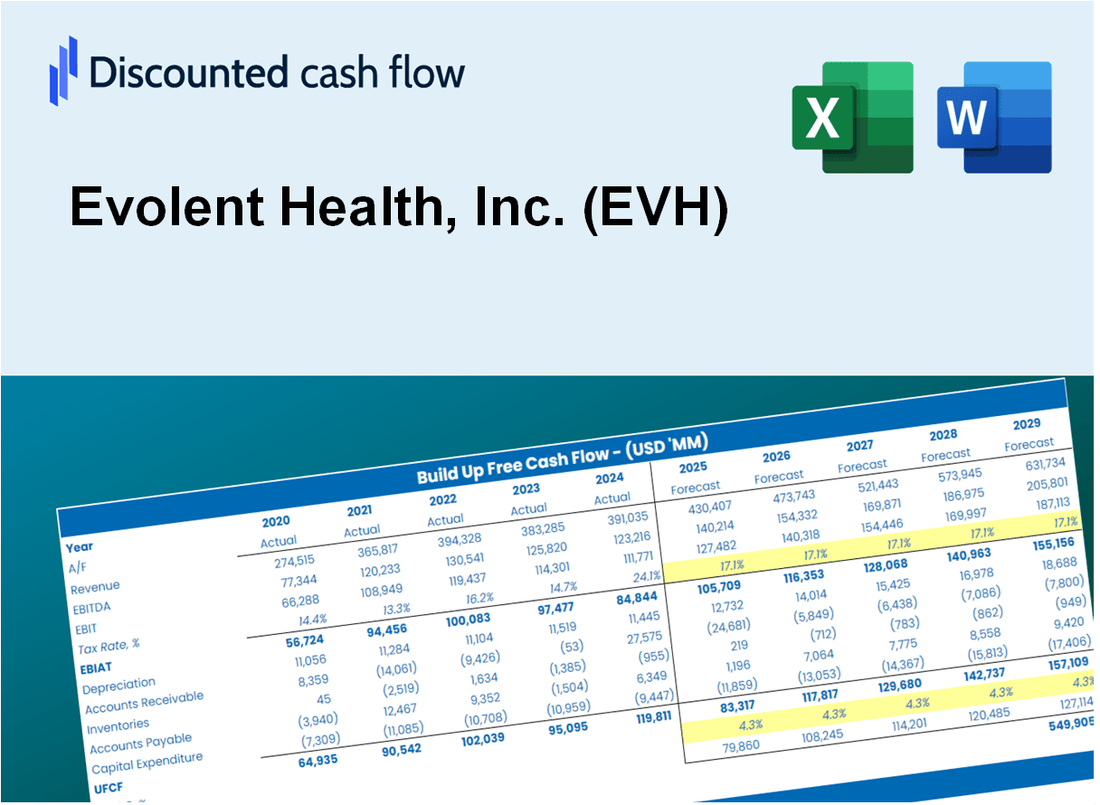
Explorez les perspectives financières d'Evolent Health, Inc. (EVH) avec notre calculatrice DCF conviviale! Entrez vos projections pour la croissance, les marges et les dépenses pour déterminer la valeur intrinsèque d'Evolent Health, Inc. (EVH) et éclairer vos décisions d'investissement.
Discounted Cash Flow (DCF) - (USD MM)
| Year | AY1 2020 |
AY2 2021 |
AY3 2022 |
AY4 2023 |
AY5 2024 |
FY1 2025 |
FY2 2026 |
FY3 2027 |
FY4 2028 |
FY5 2029 |
|---|---|---|---|---|---|---|---|---|---|---|
| Revenue | 924.6 | 908.0 | 1,352.0 | 1,963.9 | 2,554.7 | 3,336.8 | 4,358.2 | 5,692.3 | 7,434.8 | 9,710.7 |
| Revenue Growth, % | 0 | -1.8 | 48.91 | 45.26 | 30.09 | 30.61 | 30.61 | 30.61 | 30.61 | 30.61 |
| EBITDA | -240.7 | 55.7 | 43.7 | -24.8 | 84.9 | -97.5 | -127.4 | -166.3 | -217.3 | -283.8 |
| EBITDA, % | -26.04 | 6.13 | 3.24 | -1.26 | 3.32 | -2.92 | -2.92 | -2.92 | -2.92 | -2.92 |
| Depreciation | 61.5 | 60.0 | 90.3 | 123.4 | 123.2 | 207.2 | 270.6 | 353.4 | 461.6 | 602.9 |
| Depreciation, % | 6.65 | 6.61 | 6.68 | 6.28 | 4.82 | 6.21 | 6.21 | 6.21 | 6.21 | 6.21 |
| EBIT | -302.2 | -4.4 | -46.5 | -148.2 | -38.3 | -304.7 | -397.9 | -519.7 | -678.8 | -886.6 |
| EBIT, % | -32.68 | -0.48196 | -3.44 | -7.55 | -1.5 | -9.13 | -9.13 | -9.13 | -9.13 | -9.13 |
| Total Cash | 319.0 | 266.3 | 188.2 | 192.8 | 163.5 | 627.1 | 819.0 | 1,069.8 | 1,397.2 | 1,825.0 |
| Total Cash, percent | .0 | .0 | .0 | .0 | .0 | .0 | .0 | .0 | .0 | .0 |
| Account Receivables | 124.4 | 130.6 | 254.7 | 446.7 | 414.7 | 571.6 | 746.6 | 975.2 | 1,273.7 | 1,663.5 |
| Account Receivables, % | 13.45 | 14.38 | 18.84 | 22.75 | 16.23 | 17.13 | 17.13 | 17.13 | 17.13 | 17.13 |
| Inventories | -445.1 | .0 | .0 | .0 | .0 | -321.2 | -419.6 | -548.0 | -715.8 | -934.9 |
| Inventories, % | -48.14 | 0 | 0 | 0 | 0 | -9.63 | -9.63 | -9.63 | -9.63 | -9.63 |
| Accounts Payable | 32.0 | 96.1 | 57.2 | 48.2 | 96.0 | 163.4 | 213.4 | 278.7 | 364.1 | 475.5 |
| Accounts Payable, % | 3.46 | 10.58 | 4.23 | 2.46 | 3.76 | 4.9 | 4.9 | 4.9 | 4.9 | 4.9 |
| Capital Expenditure | -29.5 | -25.0 | -38.4 | -28.7 | -24.9 | -74.8 | -97.8 | -127.7 | -166.8 | -217.8 |
| Capital Expenditure, % | -3.19 | -2.75 | -2.84 | -1.46 | -0.97438 | -2.24 | -2.24 | -2.24 | -2.24 | -2.24 |
| Tax Rate, % | 2.24 | 2.24 | 2.24 | 2.24 | 2.24 | 2.24 | 2.24 | 2.24 | 2.24 | 2.24 |
| EBITAT | -305.6 | -5.5 | -14.4 | -82.8 | -37.5 | -234.3 | -306.0 | -399.7 | -522.0 | -681.8 |
| Depreciation | ||||||||||
| Changes in Account Receivables | ||||||||||
| Changes in Inventories | ||||||||||
| Changes in Accounts Payable | ||||||||||
| Capital Expenditure | ||||||||||
| UFCF | 79.1 | -357.7 | -125.5 | -189.1 | 140.7 | 129.7 | -159.8 | -208.7 | -272.6 | -356.0 |
| WACC, % | 4.2 | 4.2 | 2.65 | 3.21 | 4.15 | 3.68 | 3.68 | 3.68 | 3.68 | 3.68 |
| PV UFCF | ||||||||||
| SUM PV UFCF | -743.9 | |||||||||
| Long Term Growth Rate, % | 4.00 | |||||||||
| Free cash flow (T + 1) | -370 | |||||||||
| Terminal Value | 115,769 | |||||||||
| Present Terminal Value | 96,630 | |||||||||
| Enterprise Value | 95,886 | |||||||||
| Net Debt | 609 | |||||||||
| Equity Value | 95,277 | |||||||||
| Diluted Shares Outstanding, MM | 115 | |||||||||
| Equity Value Per Share | 830.79 |
What You Will Receive
- Customizable Excel Template: A fully adjustable Excel-based DCF Calculator featuring pre-filled real EVH financials.
- Authentic Data: Historical performance data and forward-looking projections (highlighted in the yellow cells).
- Adjustable Forecasts: Modify forecast parameters such as revenue growth, EBITDA %, and WACC.
- Instant Calculations: Quickly observe how your inputs affect Evolent Health’s valuation.
- Professional Resource: Designed for investors, CFOs, consultants, and financial analysts.
- User-Centric Layout: Organized for clarity and ease of navigation, complete with step-by-step guidance.
Key Features
- Comprehensive EVH Data: Pre-filled with Evolent Health's historical performance metrics and future growth estimates.
- Fully Customizable Inputs: Modify revenue growth rates, profit margins, discount rates, tax implications, and capital investments.
- Dynamic Valuation Model: Instant updates to Net Present Value (NPV) and intrinsic value based on user-defined parameters.
- Scenario Analysis: Generate various forecast scenarios to evaluate distinct valuation possibilities.
- User-Friendly Interface: Intuitive, organized, and suitable for both industry experts and newcomers.
How It Works
- Download: Get the comprehensive Excel file containing Evolent Health's (EVH) financial data.
- Customize: Modify forecasts, such as revenue growth, EBITDA %, and WACC.
- Update Automatically: Intrinsic value and NPV calculations refresh in real-time.
- Test Scenarios: Develop various projections and compare results instantly.
- Make Decisions: Leverage the valuation outcomes to inform your investment strategy.
Why Choose This Calculator for Evolent Health, Inc. (EVH)?
- Accurate Data: Utilizes real Evolent Health financials for trustworthy valuation outcomes.
- Customizable: Tailor key metrics such as growth rates, WACC, and tax rates to align with your forecasts.
- Time-Saving: Built-in calculations save you from starting from the ground up.
- Professional-Grade Tool: Crafted for investors, analysts, and consultants in the healthcare sector.
- User-Friendly: Simple interface and clear instructions make it accessible for all users.
Who Should Use This Product?
- Investors: Accurately estimate Evolent Health, Inc.'s (EVH) fair value before making investment decisions.
- CFOs: Leverage a professional-grade DCF model for financial reporting and analysis specific to Evolent Health, Inc. (EVH).
- Consultants: Quickly adapt the template for valuation reports tailored to Evolent Health, Inc. (EVH) for clients.
- Entrepreneurs: Gain insights into financial modeling techniques utilized by leading healthcare companies like Evolent Health, Inc. (EVH).
- Educators: Use it as a teaching tool to demonstrate valuation methodologies relevant to Evolent Health, Inc. (EVH).
What the Template Contains
- Historical Data: Includes Evolent Health’s past financials and baseline forecasts.
- DCF and Levered DCF Models: Detailed templates to calculate Evolent Health’s intrinsic value.
- WACC Sheet: Pre-built calculations for Weighted Average Cost of Capital.
- Editable Inputs: Modify key drivers like growth rates, EBITDA %, and CAPEX assumptions.
- Quarterly and Annual Statements: A complete breakdown of Evolent Health’s financials.
- Interactive Dashboard: Visualize valuation results and projections dynamically.
Disclaimer
All information, articles, and product details provided on this website are for general informational and educational purposes only. We do not claim any ownership over, nor do we intend to infringe upon, any trademarks, copyrights, logos, brand names, or other intellectual property mentioned or depicted on this site. Such intellectual property remains the property of its respective owners, and any references here are made solely for identification or informational purposes, without implying any affiliation, endorsement, or partnership.
We make no representations or warranties, express or implied, regarding the accuracy, completeness, or suitability of any content or products presented. Nothing on this website should be construed as legal, tax, investment, financial, medical, or other professional advice. In addition, no part of this site—including articles or product references—constitutes a solicitation, recommendation, endorsement, advertisement, or offer to buy or sell any securities, franchises, or other financial instruments, particularly in jurisdictions where such activity would be unlawful.
All content is of a general nature and may not address the specific circumstances of any individual or entity. It is not a substitute for professional advice or services. Any actions you take based on the information provided here are strictly at your own risk. You accept full responsibility for any decisions or outcomes arising from your use of this website and agree to release us from any liability in connection with your use of, or reliance upon, the content or products found herein.